
Automated multi-department reporting is defined as the practice of connecting data from finance, operations, marketing, and other business units into a single governed pipeline that generates, formats, and distributes reports without manual intervention. The goal is not just speed. It is accuracy, consistency, and trust across every team that relies on those numbers. Manual reporting consumes 200–500 hours per month in mid-market firms, with error rates between 5% and 8%. That scale of waste makes the case for automation before any technology conversation begins. When you automate reports across multiple departments, you replace fragile spreadsheet handoffs with a system that runs on schedule, flags anomalies, and delivers the right insight to the right person every time.
What tools and prerequisites do you need to automate reports across multiple departments?
The foundation of cross-department report automation is not software. It is a shared definition of what each metric means. Establishing a KPI dictionary acts as a contract between departments, specifying the formula, data source, and owner for every measure before a single pipeline is built. Without this, finance calculates revenue one way and sales calculates it another. The result is reports that no one trusts.
Once definitions are locked, the data integration layer comes next. Most organizations already run an ERP, a CRM, and at least one marketing platform. The right approach layers automation above these systems rather than replacing them. ELT pipelines extract data from each source, load it into a central warehouse, and transform it under a shared semantic layer that enforces your KPI definitions automatically.
The tool categories you need fall into three groups:
- Data integration platforms: These connect source systems via APIs and sync data to a central warehouse on a schedule. Two-way sync tools go further by creating lasting relationships between items in different systems, so updates flow through automatically without manual reconciliation.
- Orchestration and low-code automation tools: Platforms like n8n schedule and trigger report generation workflows without requiring custom code for every step.
- AI narrative generators: Large language models, including GPT-4, convert structured KPI data into plain-English summaries that non-technical stakeholders can act on immediately.
A semantic layer sits above all of this. It translates raw database fields into business terms, so every department queries the same logic even when pulling from different tools.
Pro Tip: Never rip out a working ERP or CRM to start fresh. Layer your automation and governance above existing systems. You protect institutional knowledge and cut implementation time significantly.
How do you build an automated cross-department report generation pipeline?
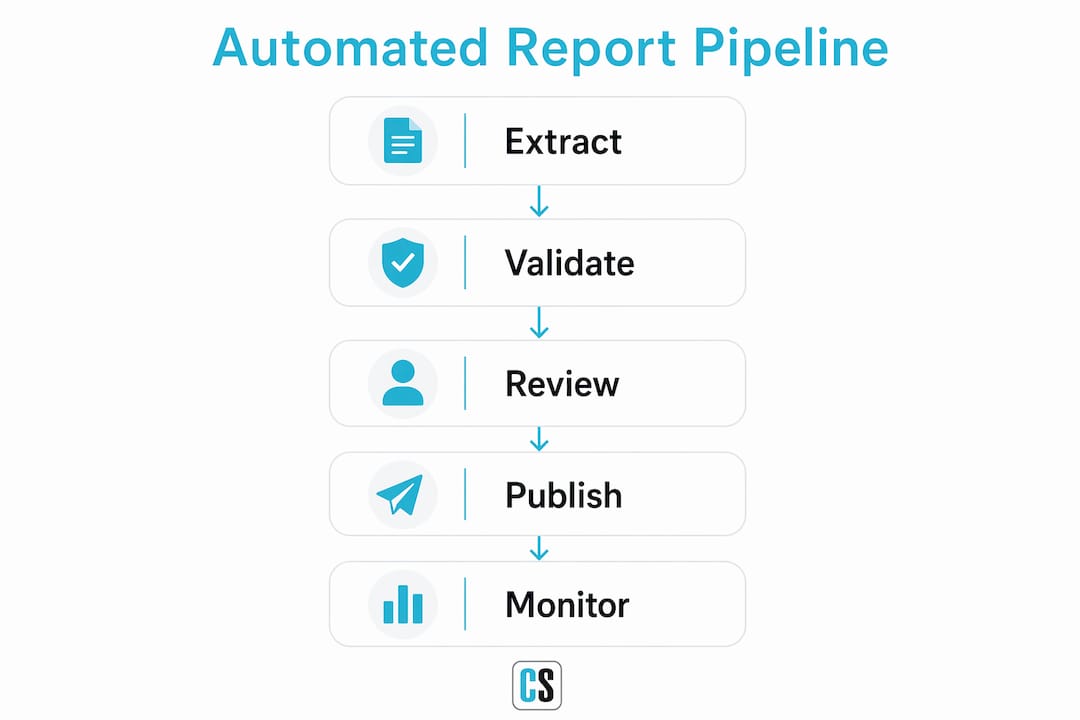
A reliable pipeline follows four stages: extract, normalize, validate, and publish. Each stage has a clear input, a defined transformation, and a measurable output. Skipping any stage is where most automation projects break down.
- Extract: Pull raw data from every source system on a fixed schedule. APIs are the most reliable method. Flat-file exports are acceptable as a fallback but require stricter monitoring.
- Normalize: Apply your KPI dictionary logic to transform raw fields into standardized metrics. This is where your semantic layer does the heavy lifting. Revenue from the ERP and pipeline value from the CRM get reconciled into a single "net revenue" figure every team agrees on.
- Validate: Run automated checks before any report is generated. Flag records where values fall outside expected ranges. Route exceptions to a human reviewer rather than letting bad data flow silently into a published report.
- Publish: Generate the formatted report and distribute it. AI workflows using GPT-4 write plain-English narratives alongside the structured data, producing PDF, HTML, or Google Docs output that saves hours of manual writing per cycle.
For high-stakes reports, insert a review step between validation and publication. A department head gets a preview link, approves or flags issues, and the system publishes only after sign-off. This keeps automation fast while preserving human judgment where it matters.
| Step | Key tool category | Outcome |
|---|---|---|
| Extract | API connectors, ELT platform | Raw data lands in central warehouse |
| Normalize | Semantic layer, KPI dictionary | Consistent, agreed-upon metrics |
| Validate | Automated quality checks | Errors flagged before distribution |
| Narrate | LLM narrative generator | Plain-English summary added to report |
| Publish | Scheduling tool, distribution engine | Right report reaches the right audience |

An initial automated executive report covering 8–15 KPIs can be built and delivered in 2–4 weeks. That fast cycle creates early wins and builds organizational confidence in the system.
Pro Tip: Build each department's data pull as a modular sub-workflow. Reusing modular sub-workflows across multiple report types cuts maintenance time and makes adding a new department a configuration task, not a development project.
What are the common challenges in automated reporting workflows across departments?
The most frequent failure point is inconsistent metric definitions. Finance and marketing may both track "customer acquisition cost," but calculate it differently. When those figures land in the same executive report, the numbers contradict each other and stakeholders lose confidence in the entire system. The fix is the KPI dictionary, applied before any pipeline runs.
Data fragmentation is the second major challenge. Source systems go offline, API rate limits get hit, and file exports arrive late or malformed. Monitoring automation pipelines with alerting systems that flag unexpected outputs prevents silent errors from reaching stakeholders. An alert that fires at 6:00 AM when a data pull fails is far less damaging than a CFO discovering a blank column in a board report.
"Treating analytics as an engineering outcome, with quality checks and semantic layers built in from the start, is what separates trustworthy reporting environments from ones that require constant firefighting." This principle applies directly to multi-department pipelines, where a single bad data feed can corrupt reports across every business unit downstream.
A few additional challenges to plan for:
- Reconciliation failures: When two systems report different totals for the same period, the pipeline needs a defined tiebreaker rule, not a manual investigation every time.
- Security and auditability: Every automated report should carry a timestamp, a data lineage note, and access controls that match the sensitivity of the content.
- The single-dashboard mistake: Effective report distribution uses a three-tier architecture: executive digests, functional dashboards for operational teams, and anomaly alerts with root-cause explanations. One generic dashboard serves no one well.
Pro Tip: Set up a "data freshness" check as the first step in every pipeline run. If source data has not updated within its expected window, halt the run and alert the data owner before generating any report.
How does automating reports across departments improve business outcomes?
The time savings are the most visible benefit. Companies save 2–6 hours weekly per team by deploying automated agents that connect, harmonize, analyze, and distribute cross-system data. Across five departments, that is up to 30 hours per week returned to analysis and decision-making rather than data wrangling.
Accuracy improves just as significantly. Manual consolidation of data from multiple systems carries error rates between 5% and 8%. Automated pipelines with validation checks bring that rate close to zero. Decision-makers stop second-guessing the numbers and start acting on them.
The less obvious benefit is alignment. When every department pulls from the same semantic layer and sees the same KPI definitions, cross-functional conversations change. Balancing enterprise-wide KPI logic with departmental customization gives teams ownership of their metrics while preserving one source of truth. Disagreements shift from "your numbers are wrong" to "here is what the shared data shows."
Automated variance analysis adds another layer of value. When revenue drops 12% below forecast, the system does not just report the gap. It triggers a workflow: an alert goes to the sales director, a root-cause query runs against the pipeline data, and a summary lands in the next morning's executive digest. That is the difference between a reporting system and a decision support system.
You can explore self-service reporting automation as a practical path to reducing labor costs while giving department heads direct access to their own governed data.
Key Takeaways
Automating reports across multiple departments requires a KPI dictionary, a governed data pipeline, and a three-tier distribution model before any technology delivers lasting value.
| Point | Details |
|---|---|
| KPI dictionary first | Define every metric's formula, source, and owner before building any pipeline. |
| Layer, don't replace | Automate above existing ERP, CRM, and marketing systems to protect institutional data. |
| Validate before publishing | Run automated quality checks at every pipeline stage to prevent bad data from reaching stakeholders. |
| Use three-tier distribution | Deliver executive digests, functional dashboards, and anomaly alerts separately for maximum relevance. |
| Measure time savings | Track hours recovered per team weekly to quantify ROI and build internal support for expansion. |
The governance gap most automation projects ignore
After working with operational leaders across industries, the pattern I see most often is this: organizations invest in the technology and skip the governance. They connect the systems, build the pipeline, and launch a dashboard. Six months later, the dashboard is ignored because two departments still disagree on what "active customer" means.
The technology is the easy part. The hard part is getting a VP of Finance and a VP of Sales to sit in a room and agree on a single definition before the first query runs. Leadership consensus consistently shows that fixing data wrangling and establishing shared definitions matters more than any tool selection. I have seen organizations with modest automation platforms outperform peers running expensive enterprise BI stacks, simply because the former did the definitional work first.
My honest recommendation: treat cross-department report automation as an operating system upgrade for your organization. That means establishing governance rhythms, monthly KPI review meetings, and a named data owner for every metric. The AI narrative tools and scheduling engines are powerful, but they amplify whatever data discipline you already have. Good governance produces trusted reports. Poor governance produces automated noise at scale.
The emerging role of AI in anomaly detection is worth watching closely. Systems that not only report a variance but explain its likely cause will change how operational leaders spend their mornings. The shift from "what happened" to "why it happened" is where the real productivity gain lives.
— Bobbieann Gordon
How ChristianSteven Software supports multi-department report automation
ChristianSteven Software has spent more than two decades turning complex reporting workflows into reliable, hands-free processes. Its product suite covers the platforms operational teams already use: PBRS for Power BI, ATRS for Tableau Reports, CRD for Crystal Reports, and IntelliFront BI for real-time dashboards and KPIs.
For organizations running Power BI, scheduling and automating Power BI reports across departments is a direct use case for PBRS, which handles formatting, scheduling, and delivery to the right recipient in the right format. Teams using Tableau can apply the same logic through automated Tableau report sharing with ATRS. ChristianSteven Software holds SOC 2 Type II certification, which means the security and auditability requirements that enterprise reporting demands are built in, not bolted on.
FAQ
What is cross-department report automation?
Cross-department report automation is the practice of connecting data from multiple business units into a single governed pipeline that generates and distributes reports on a schedule without manual effort.
How long does it take to build an automated reporting pipeline?
An initial executive report covering 8–15 KPIs can be operational in 2–4 weeks, with additional departments and report types added as governance and templates mature.
What is the biggest risk in automating reports across departments?
The primary risk is inconsistent metric definitions between teams. Without a shared KPI dictionary, automated pipelines distribute conflicting numbers that erode stakeholder trust faster than manual reports ever did.
How do automated reports improve decision-making speed?
Automated pipelines deliver validated, narrative-enriched reports on a fixed schedule, so decision-makers receive accurate data before their first meeting rather than waiting for a manual consolidation to finish.
Does automating reports require replacing existing systems?
No. The recommended approach layers automation and governance above existing ERP, CRM, and marketing platforms. Integrating reports across teams works best when it builds on the systems departments already trust.