
Choose Export Data for a one-off visual snapshot, Analyze in Excel for a live PivotTable connected to your dataset, or a scheduled export when you need automated, recurring delivery. Those three paths cover nearly every Power BI to Excel scenario you'll encounter.
Here's what each method delivers at a glance:
- Export Data (visual or dashboard tile): Produces a static .xlsx or .csv of what the visual shows. Works in the Power BI service and Desktop. Requires at least Viewer access; underlying data export requires the report designer to enable it.
- Analyze in Excel: Creates a live OLE DB connection to the Power BI semantic model. You get a real PivotTable, not a flat file. Requires a Power BI Pro or Premium Per User license and the Analyze in Excel feature enabled by your admin.
- Paginated report export: Best for large, formatted tabular output. Exports directly to .xlsx with multi-sheet support and far fewer row-limit concerns than visual exports.
- Scheduled export (Power Automate or on-prem scheduler): Hands-free delivery on a defined cadence. Requires Power Automate licensing or a dedicated scheduler like PBRS.
Top blockers to know before you start: export permissions controlled by the dataset owner, row limits (roughly 150,000 rows for summarized data and 30,000 rows for underlying data in many configurations), and Excel's own worksheet row ceiling of 1,048,576 rows.
Key Takeaways
Matching the right export method to the job — and knowing the permission and row-limit constraints up front — is what separates a smooth Power BI Excel export from a frustrating one.
| Point | Details |
|---|---|
| Three core export paths | Use Export Data for quick snapshots, Analyze in Excel for live PivotTable analysis, and paginated reports for large formatted output. |
| Row limits apply | Summarized exports cap at roughly 150,000 rows; underlying data exports cap at roughly 30,000 rows in many configurations. |
| Permissions control access | Dataset owners set whether consumers can export underlying data; RLS and sensitivity labels can block exports entirely. |
| Automation scales delivery | Power Automate handles moderate volume; a dedicated scheduler like PBRS handles enterprise volume with guaranteed delivery and advanced formatting. |
| ChristianSteven PBRS | Automates Power BI to Excel exports with multi-sheet output, data-driven scheduling, retry logic, and SOC 2 Type II security. |
Table of Contents
- What Power BI Excel export method fits your situation?
- How to export data from a report visual or dashboard tile
- How does Analyze in Excel connect you to the Power BI dataset?
- When should you export a paginated report to Excel?
- Who controls whether you can export from Power BI?
- What limits and formatting issues should you expect?
- How can you automate Power BI exports to Excel?
- How analysts actually move from Power BI to Excel workflows
- PBRS handles Power BI to Excel exports at enterprise scale
- Sources
- FAQ
What Power BI Excel export method fits your situation?
Matching the method to the job saves time and avoids hitting a wall mid-export.
- Ad-hoc visual snapshot: Use Export Data from the visual's More options menu. Fast, no setup, works for any consumer with Viewer access.
- Analyst exploration with measures and aggregations: Use Analyze in Excel. You keep the dataset's DAX measures live and can slice with any dimension without re-exporting.
- Full dataset delivery or large row counts: Use a paginated report export to .xlsx. Paginated reports handle high row counts and preserve column formatting far better than visual exports.
- Recurring scheduled delivery to a team: Use Power Automate or a dedicated on-prem scheduler. Power Automate handles moderate volume; a scheduler like PBRS handles enterprise volume with guaranteed delivery and advanced formatting.
- Raw data for downstream ETL: Export as .csv from a paginated report or request the dataset owner to supply a direct extract. CSV avoids Excel formatting quirks that can corrupt numeric or date fields.
License and feature notes: Export Data works on Power BI Free for reports you own; the Power BI service requires at least a Pro license to share. Analyze in Excel requires Pro or Premium Per User. Paginated reports require a Premium capacity or Premium Per User workspace. Scheduled cloud flows in Power Automate require a Power Automate license with premium connectors.
Pro Tip: Before attempting an underlying data export, check who owns the dataset. Open the report, go to File → Info, and look for the dataset owner's name. A quick message to that person is faster than troubleshooting a blocked export for an hour.
How to export data from a report visual or dashboard tile
This is the fastest path for a one-off Power BI Excel export. Connectorly's walkthrough shows the exact consumer flow clearly.
Exporting from a report visual
- Open the report in the Power BI service.
- Hover over the visual you want to export.
- Click the More options (…) menu in the top-right corner of the visual.
- Select Export data.
- Choose Summarized data (what the visual displays) or Underlying data (row-level source rows, if enabled).
- Choose the file format: .xlsx or .csv.
- Click Export. The file downloads immediately.
For table and matrix visuals, you'll also see a Data with current layout option. This preserves column order, subtotals, and the visual's current filter state — use it when the recipient needs the data formatted exactly as it appears on screen.
Exporting from a dashboard tile
- Open the dashboard in the Power BI service.
- Click the More options (…) on the tile.
- Select Export data and follow the same .xlsx/.csv choice.
Summarized vs. underlying data
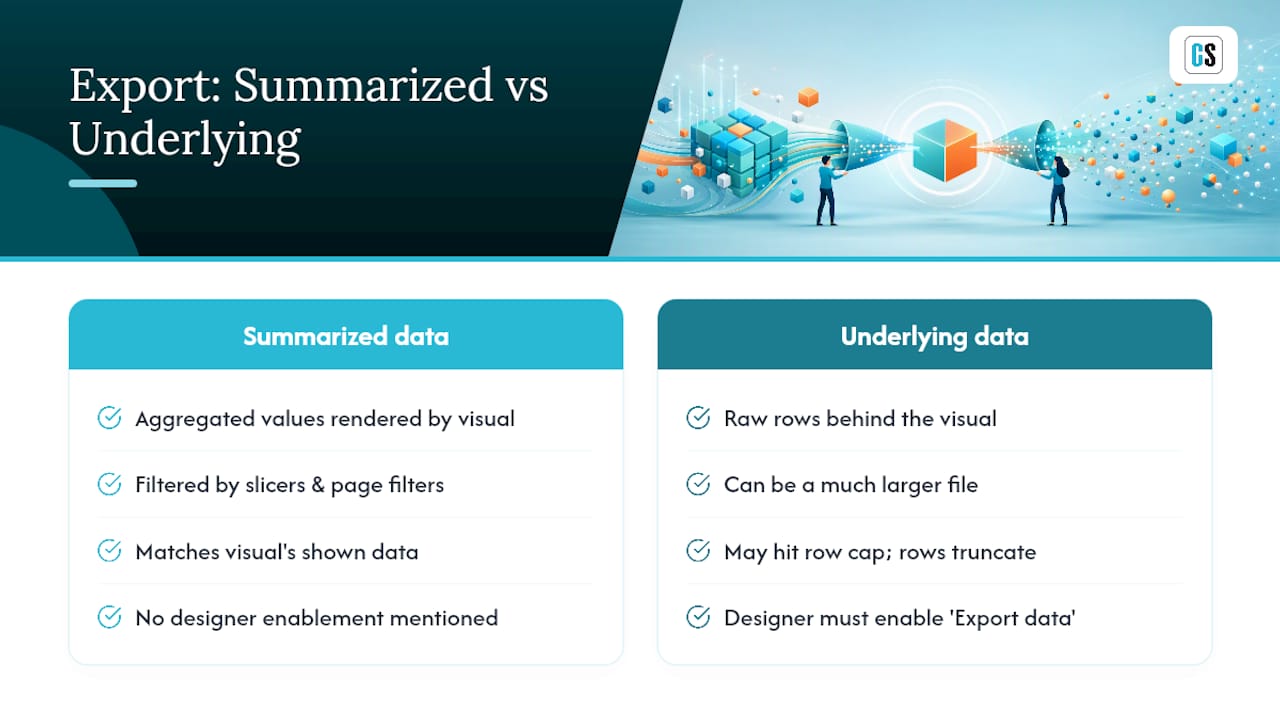
Summarized data reflects only what the visual renders — aggregated values, filtered by any slicers or page filters active at the time. Underlying data exports the raw rows behind the visual, which can be a much larger file and is only available when the report designer has explicitly enabled it in Power BI Desktop under File → Options and settings → Report settings → Export data.
TechRepublic's step-by-step guide covers how designers configure this permission in detail.
Pro Tip: If your export is truncating rows, remove page-level filters before exporting or switch to a .csv export of a smaller visual slice. Exporting a filtered subset and repeating for each slice is tedious but avoids hitting the row cap.
How does Analyze in Excel connect you to the Power BI dataset?
Analyze in Excel is the right choice when you need to explore the data with your own PivotTable rather than download a static snapshot. It gives you a live OLE DB connection to the Power BI semantic model, so DAX measures recalculate as you pivot and slice — no re-exporting needed.
Prerequisites
- A Power BI Pro or Premium Per User license.
- The Analyze in Excel feature enabled by your Power BI admin (tenant setting: Allow users to open datasets in Excel using Analyze in Excel).
- Excel 2016 or later (Microsoft 365 recommended). You may need to install or update the Analysis Services OLE DB provider if prompted.
- Build permission on the dataset (granted by the dataset owner).
Setup steps
- In the Power BI service, open the workspace and find the dataset or report.
- Click More options (…) next to the dataset name.
- Select Analyze in Excel. Power BI generates and downloads a small .odc connection file.
- Open the file in Excel. Excel connects to the dataset and opens a blank PivotTable pane.
- Drag fields, measures, and dimensions from the PivotTable field list to build your analysis.
- Save the .xlsx locally. The connection persists; the next time you open the file, Excel refreshes against the live dataset (requires network access and valid credentials).
For a detailed enterprise walkthrough including how to layer automation on top of this connection, the ChristianSteven Analyze in Excel guide is worth bookmarking.
Practical tradeoffs
Analyze in Excel gives you live measures and the full power of Excel's PivotTable engine. What it does not give you is a flat table of raw rows unless the dataset owner has granted underlying export access. If your job is exploratory analysis — slicing revenue by region, comparing year-over-year measures — Analyze in Excel is faster and more repeatable than exporting rows and rebuilding PivotTables manually.
Pro Tip: Combine Analyze in Excel with Power Query inside the same workbook. Use the live PivotTable for summary views and a Power Query connection to the same dataset for any flat-table transformations. You get both aggregated and granular views without maintaining two separate files.
When should you export a paginated report to Excel?
Paginated reports are the right tool when you need a complete, formatted export with many rows. Unlike visual exports, they render the entire dataset — not just what fits on screen — and write directly to .xlsx with column headers, data types, and multi-sheet output intact.
Steps to export a paginated report
- Open the paginated report in the Power BI service (it must be published to a Premium or Premium Per User workspace).
- Click the Export button in the report toolbar.
- Select Excel from the format list. For raw data without formatting, choose CSV.
- The report renders and downloads as an .xlsx file, with each report page or data region mapped to a separate worksheet.
Why paginated reports beat visual exports for large data
Visual exports hit row caps quickly. Paginated reports are designed for exactly this use case: pixel-perfect tabular output, thousands of rows, and consistent column formatting. They also support parameters, so you can scope the export to a specific date range or business unit before downloading.
A few practical notes:
- Multi-matrix reports export each matrix to its own sheet by default, which keeps large datasets organized.
- If you need a raw extract for ETL, .csv from a paginated report avoids any Excel cell-type coercion.
- When a paginated report isn't available, ask the dataset owner for a direct extract rather than trying to work around visual row limits.
Who controls whether you can export from Power BI?
Export access is not just a button you click. Dataset owners and report designers control what consumers can export, and several layers of settings can block or restrict exports entirely.
Settings that affect exports
- Power BI Desktop (report designer): File → Options and settings → Options → Report settings → "Export data" controls whether consumers see the Summarized data option, the Underlying data option, or neither.
- Power BI service (workspace admin): Tenant-level settings in the Admin portal under Export and sharing settings govern whether exports are allowed at all for the organization.
- Row-level security (RLS): If RLS is applied to the dataset, consumers can only export rows their role permits. They cannot export data they cannot see in the report.
- Sensitivity labels: A dataset labeled Confidential or Highly Confidential may block export entirely or require the exported file to inherit the same label, which can prevent opening in some environments.
Pro Tip: If Export data is grayed out or missing, the fastest fix is to contact the dataset owner directly. Ask them to enable "Allow users to export underlying data" in Desktop's Report settings and republish. That single change unlocks underlying exports for all consumers with appropriate permissions.
As TechRepublic notes, practical export workflows are often limited not by technical capability but by governance settings the dataset owner controls.
What limits and formatting issues should you expect?
Row limits, file size, and formatting loss are the three things most likely to surprise you mid-export.
- Row limits: Summarized data exports cap at roughly 150,000 rows; underlying data exports cap at roughly 30,000 rows in many configurations, per DataCamp's export guide. These limits are subject to tenant configuration and can vary.
- Excel worksheet ceiling: Excel itself caps a single worksheet at 1,048,576 rows. If your export approaches that, split the data across multiple exports or use a paginated report with multiple sheets.
- Formatting loss: Conditional formatting, color scales, data bars, and KPI icons do not survive a standard Export Data export. The Data with current layout option for table and matrix visuals preserves column order and subtotals, but not color formatting.
- Data type quirks: Date fields sometimes export as text strings, and decimal numbers can lose precision depending on the locale settings of the export. Opening the .xlsx and reformatting columns as Date or Number fixes most cases. For downstream ETL, .csv with explicit type handling in Power Query is more reliable.
- Common errors and fixes:
- Export button missing or grayed out: Check with the dataset owner about Report settings permissions.
- Export fails mid-download: Try switching to .csv, which is less memory-intensive than .xlsx for large exports.
- Browser timeout on large exports: Use a different browser or reduce the row count with additional filters before exporting.
- Sensitivity label blocks the file: Contact your IT admin to adjust label policies or request an unlabeled extract.
How can you automate Power BI exports to Excel?
Automated exports run on three main routes, each with a different ceiling on volume, flexibility, and reliability.
Power BI subscriptions
The simplest option. Set up a subscription on a report page and Power BI emails a PDF or PNG snapshot on a schedule. It does not deliver a true .xlsx file, so it's useful for awareness but not for downstream data work.
Power Automate scheduled flows
Microsoft Learn documents the full flow for exporting and emailing a Power BI report using a scheduled cloud flow. You can export to PDF or PowerPoint from the Power BI connector, then attach and email the file. For Excel specifically, you combine the export action with a SharePoint or OneDrive write step.
- Formats supported: PDF, PowerPoint, PNG (standard reports); .xlsx and .csv via paginated report connector.
- Scheduling: Recurrence trigger, any frequency.
- Limitations: Power Automate flows can be throttled under high volume; error handling requires manual flow configuration; complex multi-recipient or data-driven delivery needs significant flow logic.
On-premises schedulers (PBRS and similar)
For enterprise volume, guaranteed delivery, and advanced formatting, a dedicated on-prem scheduler is the most reliable path. Tools like PBRS (Power BI Report Scheduler by ChristianSteven Software) handle scheduled Power BI exports to Excel with multi-sheet workbook output, data-driven scheduling, retry logic, and delivery to email, SharePoint, network folders, or FTP.
- Formats: .xlsx (multi-sheet), .csv, PDF, and more.
- Scheduling: Time-based, event-triggered, or data-driven (e.g., export only when a KPI threshold is met).
- Error handling: Built-in retry and alert notifications — no manual flow debugging.
- Security: On-prem deployment keeps data inside your network perimeter.
For a side-by-side look at scheduling approaches and their tradeoffs, the ChristianSteven scheduling overview covers the decision points clearly.
Pro Tip: Move from Power Automate to a dedicated scheduler when you hit any of these: more than a handful of reports on the same schedule, delivery failures you can't afford to miss, recipients who need different data slices in the same workbook, or audit requirements for delivery confirmation. Power Automate is a great starting point; it's not built for enterprise-scale BI delivery.
For teams that also need to track whether scheduled exports are actually driving decisions, pairing delivery data with marketing analytics ROI metrics gives a clearer picture of reporting impact.
How analysts actually move from Power BI to Excel workflows
Most analysts follow a predictable pattern: Analyze in Excel for exploration, scheduled extracts for distribution, and .csv or .xlsx exports for archival or downstream ETL. The tools are not mutually exclusive — they serve different stages of the same workflow.
In practice, the analysts who get the most out of Power BI exports tend to do a few things consistently. They save filtered slices rather than exporting the full dataset every time, which keeps file sizes manageable and avoids row-limit issues. They use Data with current layout for any table or matrix visual where the recipient needs the data formatted exactly as it appears in the report. And they pre-define export-friendly views in Power BI Desktop — simplified table visuals with clean column names — so the exported .xlsx doesn't need heavy reformatting before it's usable.
The governance side matters just as much as the technique. Analyst agility is real, but so is data sensitivity. Before sharing an exported file outside your organization, confirm the dataset's sensitivity label and your organization's data-handling policy. A quick check with the dataset owner takes two minutes and avoids a compliance issue that takes weeks to resolve.
PBRS handles Power BI to Excel exports at enterprise scale
Manual exports work for one-off needs. When your team needs the same Excel file delivered to 50 people every Monday morning, with each recipient seeing only their data slice, manual is not a workflow — it's a bottleneck.

PBRS by ChristianSteven Software automates Power BI exports to Excel and CSV with the kind of control enterprise teams actually need: multi-sheet workbook output, data-driven scheduling, guaranteed delivery with retry logic, and delivery to email, SharePoint, network folders, or FTP. SOC 2 Type II certified and deployed on-premises, PBRS keeps your data inside your network while handling the full delivery chain hands-free.
For teams already running Power Automate flows that are hitting throttling limits or requiring too much manual maintenance, PBRS is the step up that removes the ceiling. You can also automate exports without Power Automate entirely — no cloud connector dependencies, no flow debugging.

Start a free trial or see a live demo at Go.
Sources
- How to export Power BI to Excel (Guide with Examples)
- How to export Power BI data to Excel
- How to Export Power BI to Excel (3 easy way) - Connectorly
FAQ
How do I export data from a Power BI visual to Excel?
Hover over the visual, click More options (…), select Export data, choose .xlsx or .csv, and click Export. The file downloads immediately to your browser's default download folder.
How do I enable the Export to Excel option in Power BI?
The dataset owner must open the report in Power BI Desktop, go to File → Options and settings → Options → Report settings, and enable the export data option. Tenant-level export settings in the Power BI Admin portal must also permit exports for your organization.
How do I export Power BI data automatically?
Three routes work: Power BI subscriptions (email snapshots, limited formats), Power Automate scheduled flows (flexible, supports .xlsx via paginated report connector), or a dedicated on-prem scheduler like PBRS from ChristianSteven Software, which handles enterprise volume with guaranteed delivery, multi-sheet Excel output, and built-in retry logic.
What is the export row limit for Power BI to Excel?
Summarized data exports cap at roughly 150,000 rows; underlying data exports cap at roughly 30,000 rows in many configurations, though both limits are subject to tenant settings. For larger datasets, paginated report exports or a direct dataset extract are the better options.
Why is my Power BI export button grayed out or missing?
The report designer has likely restricted exports in Report settings, or your workspace admin has disabled exports at the tenant level. Contact the dataset owner and ask them to enable export permissions in Power BI Desktop and republish the report.