
Report automation vs manual reporting is the evaluation of two distinct methods for producing business intelligence outputs, each suited to different operational contexts and decision-making needs. Automated reporting uses software to extract, transform, and deliver data without human intervention. Manual reporting relies on analysts to collect, interpret, and format data by hand. Both methods have a place in a well-run organization, but choosing the wrong one for the wrong task costs time, money, and accuracy. The hybrid approach, which automates repetitive workflows while preserving human judgment for strategic analysis, delivers the best outcomes for most business teams in 2026.
How does report automation improve efficiency and accuracy?
Automated reporting is defined as software-driven data processing that generates and delivers reports on a schedule, without requiring a person to pull the data each time. The efficiency gains are concrete. AI-driven automation reduces report generation time by 70–80% by eliminating repetitive tasks like data collection and formatting. Teams typically save 2–6 hours weekly on manual reporting tasks, with financial teams saving 5–6 hours per client monthly.

That time savings compounds quickly across a department. An analyst who spends four hours each week building the same sales dashboard reclaims more than 200 hours per year when that process is automated. Those hours shift from mechanical work to interpretation and strategy.
Accuracy improves alongside speed. Automated reporting achieves error rates below 5% after the initial implementation period. Manual reporting, by contrast, introduces inconsistent errors tied to copy-paste mistakes, formula drift, and version conflicts. Automation standardizes calculations and applies the same logic every time, which builds client and stakeholder trust in the numbers.
The benefits of report automation extend to scheduling and delivery. Reports can be generated at 6:00 AM every Monday, formatted as PDF or Excel, and sent directly to the right inbox without anyone touching a keyboard. ChristianSteven Software's PBRS product does exactly this for Power BI environments, and ATRS handles the same workflow for Tableau. Scheduling Power BI reports ahead of time removes the risk of missed deadlines and ensures decision-makers always have fresh data when they need it.
- Time savings: Automation eliminates repetitive data pulls, freeing analysts for higher-value work.
- Error reduction: Standardized logic replaces manual formulas, cutting inconsistency below 5%.
- Consistent delivery: Scheduled reports arrive on time, every time, in the right format.
- Scalability: One automated workflow handles 10 reports or 1,000 with equal effort.
- Stakeholder trust: Consistent, accurate output builds confidence in the data.
Pro Tip: Before automating any report, confirm the underlying data source is stable and clean. Automating a flawed data pipeline at scale produces flawed reports at scale, faster.
Why does manual reporting still matter for strategic analysis?
Manual reporting is defined as human-led data collection, interpretation, and narrative creation. It remains the better choice when context, judgment, and nuance are required. Automated dashboards lack business insights because they cannot explain why a metric moved, only that it moved. A skilled analyst reads the anomaly, connects it to a product launch or a market event, and writes the narrative that makes the number meaningful.
The manual reporting challenges are real, but so are its strengths. Flexibility is the clearest advantage. When a CFO needs a one-time analysis of a new revenue segment, no pre-built template fits. An analyst builds the report from scratch, selects the right metrics, and frames the findings for the specific audience. Automation cannot replicate that judgment.
Scenarios where manual reporting outperforms automation include:
- Evolving data structures: New data sources or changing definitions require human interpretation before any template can be trusted.
- Anomaly investigation: When a KPI spikes or drops unexpectedly, a human analyst determines whether it is a data error or a real business signal.
- Executive narratives: Board-level reports require written context, recommendations, and forward-looking commentary that automation cannot generate reliably.
- One-time analyses: Ad hoc requests with unique parameters do not justify the setup cost of a full automation workflow.
- Unstable workflows: Processes that change frequently break automated pipelines and require manual oversight to stay accurate.
Automated reporting is a tool for speed and consistency. Manual reporting is the tool for interpretive nuance. The mistake most organizations make is treating these as competing choices rather than complementary ones.
What are the key differences between automated and manual reporting?
The core process differences between automated and manual reporting affect speed, accuracy, scalability, resource needs, and flexibility. The table below compares these factors directly.
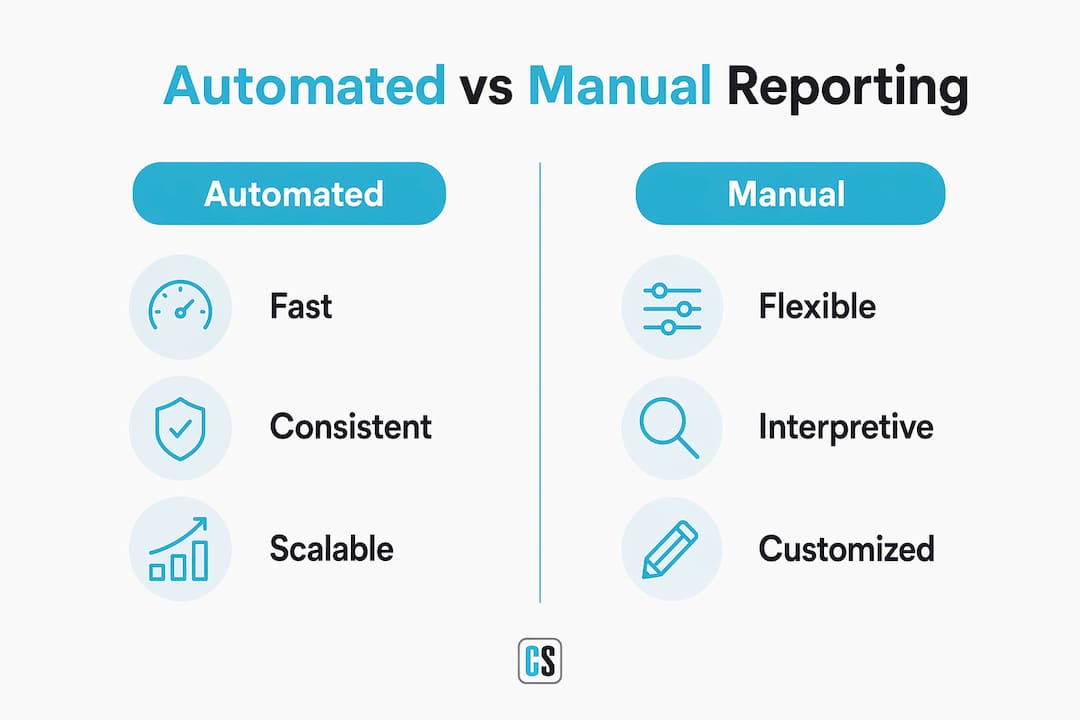
| Factor | Automated reporting | Manual reporting |
|---|---|---|
| Speed | Reports generated in seconds on a schedule | Hours to days depending on complexity |
| Accuracy | Below 5% error rate after setup | Variable; prone to human error at scale |
| Scalability | Handles high volume with no added effort | Degrades in quality as volume increases |
| Resource needs | High upfront setup; low ongoing effort | Low setup; high ongoing analyst time |
| Flexibility | Fixed templates; changes require reconfiguration | Fully flexible; adapts to any request |
| Best use case | Recurring operational metrics | Strategic, ad hoc, or narrative reports |
One common misconception about automation is that it is "set and forget." Automation requires ongoing governance to prevent "report drift," which occurs when business data evolves but automated templates do not. A report that was accurate in january may silently produce wrong numbers by july if no one monitors the underlying logic.
A second risk is the distinction between report delivery management and full report generation automation. Automating delivery alone can perpetuate errors if the underlying data extraction and transformation steps remain manual and flawed. Full automation covers data extraction, transformation, template population, and delivery as a connected pipeline.
Manual reporting scales poorly as complexity grows. Manual reporting offers flexibility and customization but risks data errors as volume increases. A team managing 50 manual reports per month faces a different error profile than one managing five. Automation is the right answer for volume. Manual judgment is the right answer for depth.
The impact of automation on reporting workflows is most positive when organizations apply it selectively. Automating every report, including strategic ones that require interpretation, produces fast but shallow outputs that mislead rather than inform.
What are the best practices for combining both reporting methods?
The most effective reporting systems use a hybrid design tailored by report type and frequency. The hybrid approach automates operational metrics while reserving manual effort for executive summaries and strategic interpretation. One practical framing: automate the mechanical 80% of reporting work and focus human effort on the strategic 20%.
Implementing this model well requires a clear sequence of steps.
- Audit your current reports. Catalog every report your team produces. Identify which ones are recurring, structured, and based on stable data. These are automation candidates.
- Eliminate redundant KPIs. Automating without auditing scales flawed data and creates "automated noise." Remove metrics that no one acts on before building any automation workflow.
- Classify by report type. Separate operational reports (daily sales, weekly pipeline, monthly financials) from strategic reports (market analysis, board presentations, scenario planning). Automate the first category. Keep the second manual.
- Build governance into the workflow. Assign ownership for each automated report. That owner reviews the output monthly to catch drift, confirm data source accuracy, and update templates when business definitions change.
- Monitor automation KPIs. Track metrics like report delivery success rate, recipient satisfaction, and time saved per report. These numbers justify the investment and signal when a workflow needs adjustment.
- Integrate AI-assisted narrative tools with human review. AI-generated narrative tools combined with manual human review produce contextual business insights that neither method achieves alone.
Pro Tip: Start your automation program with three to five high-frequency, low-complexity reports. Prove the model works, measure the time saved, and use those results to build internal support for broader adoption.
Automating report generation with BI tools like Power BI and Tableau works best when the data governance foundation is already solid. ChristianSteven Software's PBRS and ATRS products are built for exactly this kind of structured, governed automation at enterprise scale. The ROI of report automation is quantifiable through saved analyst hours, faster delivery cycles, and measurable reductions in reporting errors.
Key Takeaways
The most effective reporting strategy automates high-frequency operational metrics while preserving manual human judgment for strategic interpretation and narrative analysis.
| Point | Details |
|---|---|
| Automation saves significant time | AI-driven automation cuts report generation time by 70–80%, freeing analysts for strategic work. |
| Manual reporting handles nuance | Human judgment is required for anomaly investigation, executive narratives, and evolving data. |
| Governance prevents report drift | Automated reports need monthly review to stay accurate as business data and definitions change. |
| Audit before you automate | Eliminating redundant KPIs before automation prevents scaling flawed data across the organization. |
| Hybrid models deliver the best results | Separating operational automation from strategic manual reporting maximizes both speed and insight quality. |
Why I think most organizations automate in the wrong order
Most teams I have observed automate the reports that are easiest to build, not the ones that save the most time or deliver the most value. They start with a polished executive dashboard because it is visible and impressive. Then they wonder why analysts are still buried in spreadsheets every Monday morning.
The better approach is to start with the reports nobody wants to build. The weekly operational pulls, the recurring compliance summaries, the daily pipeline updates. These are the reports that consume the most analyst hours and require the least strategic interpretation. Automating them first creates immediate, measurable relief and builds organizational confidence in the technology.
The second mistake I see consistently is treating automation as a one-time project. Automation requires ongoing maintenance and governance. Business definitions change. Data sources shift. A report that was accurate in Q1 can silently mislead by Q3 if no one is watching. The organizations that get the most from automation are the ones that assign clear ownership and review cycles, not the ones that flip a switch and walk away.
The opportunity in 2026 is real. AI-assisted narrative generation is maturing fast, and the combination of automated data processing with human-reviewed interpretation is genuinely powerful. But the technology only works as well as the data and governance behind it. Get those right first, and automation becomes one of the highest-return investments a reporting team can make.
— Bobbieann Gordon
ChristianSteven Software automates what your team should not be doing manually
ChristianSteven Software has spent more than two decades building reporting automation that handles the mechanical work so your analysts can focus on decisions.
PBRS automates Power BI report scheduling and delivery across your entire organization, sending the right report to the right person at the right time, in the right format. ATRS does the same for Tableau automated reporting, with enterprise-grade scheduling and distribution built in. Both products are SOC 2 Type II certified, which means your data stays secure throughout every automated workflow. If your team is still pulling recurring reports by hand, ChristianSteven Software removes that burden without removing the human insight that makes those reports worth reading.
FAQ
What is the main difference between report automation and manual reporting?
Report automation uses software to extract, format, and deliver reports on a schedule without human intervention. Manual reporting relies on analysts to collect and interpret data by hand, which offers more flexibility but scales poorly.
When should I use manual reporting instead of automation?
Manual reporting is the better choice for one-time analyses, executive narratives, anomaly investigations, and any report that requires written context or strategic interpretation that automation cannot reliably produce.
How much time does report automation actually save?
Teams save 2–6 hours weekly on manual reporting tasks through automation, with financial teams saving 5–6 hours per client monthly. Those hours shift from data collection to analysis and decision-making.
Is automated reporting accurate enough to trust?
Automated reporting achieves error rates below 5% after the initial setup period. The key requirement is that the underlying data sources and transformation logic are clean and governed before automation is applied.
What is a hybrid reporting model?
A hybrid reporting model automates recurring operational metrics while keeping strategic, narrative, and ad hoc reports in human hands. The hybrid approach delivers the speed of automation and the depth of manual analysis without sacrificing either.