
Reporting system performance optimization is the process of improving the speed, accuracy, and scalability of data reporting systems through systematic techniques and automation. Finance teams that skip this process pay a steep price: 75% of reporting specialists spend roughly 300 hours per year recreating reports that already exist. That is time stolen from analysis, forecasting, and decisions. The good news is that automation alone can recover up to 40% of staff time, reduce manual errors by up to 90%, and improve report generation speed by 70%. This guide gives IT professionals and business analysts a practical, step-by-step path to get there.
What prerequisites are needed for reporting system performance optimization?
Effective reporting system performance optimization starts before you touch a single query or template. You need a clear picture of what your current system actually does, where it slows down, and why.
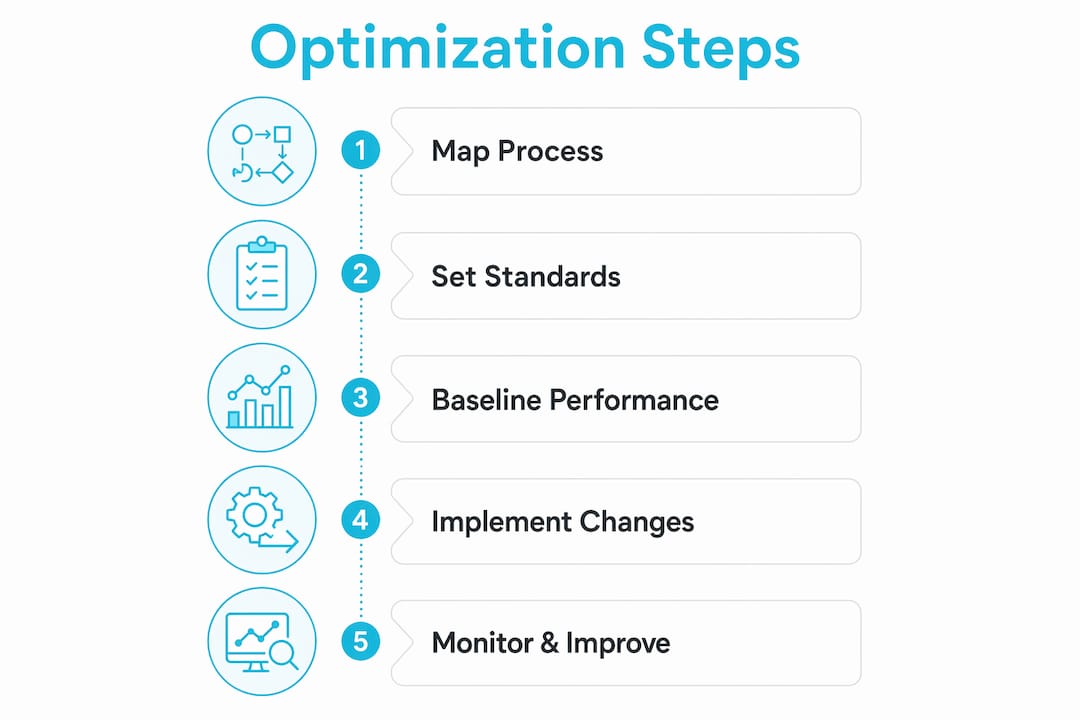
Map your current reporting processes
Process mapping is the non-negotiable first step. Walk every report from data source to final delivery and document each manual handoff, file export, and transformation step. This exercise almost always surfaces redundant steps that no one remembers adding. The Map → Eliminate → Standardize → Automate sequence is the industry standard for a reason: automating a broken process only produces errors faster.

Establish data quality and KPI standards
Data quality problems destroy optimization gains before they start. Before tuning any system, confirm that your source data is clean, consistent, and governed. AI-assisted reporting requires a KPI catalog before automation can succeed, because bottlenecks in standardized definitions block narrative generation and workflow triggers. Define every KPI in writing, agree on calculation rules, and document data owners. Without this foundation, your optimized system will deliver wrong answers faster.
Set a performance baseline
You cannot measure improvement without a starting point. Record current report generation times, error rates, and delivery success rates before making any changes. This baseline becomes your benchmark for every tuning decision that follows.
Pro Tip: Run your baseline measurements over at least two full reporting cycles. A single cycle can reflect seasonal data volume spikes that distort your numbers.
The table below shows the most common tool categories used at each stage of the optimization workflow.
| Workflow stage | Tool category | Primary function |
|---|---|---|
| Process mapping | Flowchart and BPM tools | Document and visualize report workflows |
| Data quality | ETL and data governance platforms | Cleanse, validate, and standardize source data |
| Report scheduling | Automation and scheduling software | Automate generation and delivery |
| Performance monitoring | APM and logging tools | Track speed, errors, and delivery rates |
| KPI management | BI semantic layer tools | Centralize metric definitions |
How do you implement reporting system optimization step by step?
Once your baseline is set and your processes are mapped, execution follows a clear sequence. Each step builds on the last, so skipping ahead creates hidden problems.
-
Automate data extraction. Replace manual CSV exports and copy-paste routines with scheduled, direct database connections or API calls. Manual exports are the single largest source of both errors and delays in most reporting pipelines.
-
Standardize transformations and calculations. Move all business logic into a shared layer, such as a semantic model or a centralized SQL view, rather than embedding formulas inside individual report templates. This prevents the same metric from calculating differently across two reports.
-
Redesign report templates for performance. Oracle's documentation on financial reporting recommends keeping large reports under 10,000 cells to prevent severe performance degradation. Use dense dimensions for columns and sparse dimensions for rows to reduce the number of MDX queries the engine generates. Conditional formatting and suppression rules add processing overhead, so apply them only where they deliver clear analytical value.
-
Schedule and automate distribution. Set reports to generate and deliver automatically at defined intervals. Scheduling removes the human trigger from the process, which eliminates the most common cause of late delivery. Christiansteven's ATRS product, for example, lets teams set up single report schedules for Tableau reports with precise timing and recipient controls.
-
Build exception handling and monitoring. Define what a failed or late report looks like, and configure alerts for those conditions. Continuous monitoring and exception handling are essential to sustain optimization and maintain quality over time.
-
Test changes one at a time. Performance engineering best practices require changing one parameter at a time to avoid masking the effects of individual adjustments. If you change three settings simultaneously and performance improves, you will not know which change caused it.
Pro Tip: After each change, run the report three times and average the generation time. Single-run measurements are unreliable because server load varies.
What common challenges arise during optimization, and how do you fix them?
Even well-planned optimization projects hit obstacles. Knowing the most common failure points in advance lets you resolve them before they stall progress.
-
Automating before mapping. Teams that skip process mapping automate their existing inefficiencies. The result is faster errors, not faster insights. Always complete the Map → Eliminate → Standardize sequence before writing a single automation rule.
-
Report complexity creep. Reports grow over time as stakeholders request new columns, filters, and conditional formats. Each addition adds processing load. Audit your report templates quarterly and remove elements that no one uses.
-
Resource bottlenecks at peak times. Scheduling all reports to run at 7:00 AM Monday creates a server load spike. Stagger schedules across a two-hour window to distribute the load evenly.
-
Ignoring the effect of suppression rules. Suppression logic forces the reporting engine to evaluate every row before deciding what to hide. On large datasets, this can double generation time. Replace suppression with pre-filtered data views where possible.
-
Changing multiple parameters at once. This is the most common tuning mistake. When performance drops after a system change, teams often adjust several settings simultaneously. That approach makes it impossible to isolate the cause.
"Stale data impairs timely decisions. The real business case for reporting optimization is not labor savings. It is reducing decision latency, the gap between when data is available and when a decision gets made."
When report speed drops after a system update, start your diagnosis by checking whether the data source schema changed, whether new rows were added to a large dimension table, or whether a scheduled job is now competing for the same server resources. Systematic diagnosis beats guesswork every time.
How do you measure success and continuously improve report performance?
Measuring the right metrics after optimization tells you whether your changes worked and where to focus next. Three metrics cover most of what matters: delivery time, error rate, and user satisfaction.
Delivery time is the most objective measure. Track the gap between when a report is scheduled and when it actually reaches recipients. On-time delivery rates are a direct indicator of scheduling and generation health. Case study data from 2026 shows that on-time delivery improved from 71% to 99.5% after full automation, a result that reflects both scheduling reliability and template efficiency gains.
Error rate tracks how often a report contains incorrect data, fails to generate, or triggers a manual correction. Automated reporting can cut manual error rates by up to 95%. That improvement does not happen automatically. It requires clean source data, standardized KPIs, and tested transformation logic working together.
User satisfaction captures what the numbers miss. Survey report recipients every quarter. Ask whether reports arrive on time, whether the data matches their expectations, and whether the format supports their decisions. Feedback loops surface problems that monitoring tools never catch.
The table below shows representative pre- and post-optimization benchmarks from 2026 case studies.
| Metric | Pre-optimization | Post-optimization |
|---|---|---|
| Quarterly report production time | 5 days | 6 hours |
| On-time delivery rate | 71% | 99.5% |
| Manual error rate | Baseline | Reduced by up to 95% |
| Staff time on report recreation | ~300 hours/year | Significantly reduced |
| Client portal adoption | Baseline | Increased 109% in 6 months |
Review your automation rules every quarter. Data sources change, business definitions evolve, and report templates drift from their original design. A quarterly review catches these shifts before they become performance problems.
Key Takeaways
Reporting system performance optimization delivers the largest gains when process mapping, data quality, and baseline measurement come before any automation or tuning.
| Point | Details |
|---|---|
| Map before automating | Follow Map → Eliminate → Standardize → Automate to avoid speeding up broken workflows. |
| Baseline first | Record generation times and error rates before any changes so you can measure real improvement. |
| Design reports for speed | Keep reports under 10,000 cells and use dense columns with sparse rows to reduce query load. |
| Automate scheduling and delivery | Scheduled distribution removes human triggers and is the fastest path to on-time delivery gains. |
| Measure three core metrics | Track delivery time, error rate, and user satisfaction to verify and sustain optimization results. |
What I have learned from two decades of reporting optimization
The most common mistake I see is treating optimization as a technology problem. Teams buy a new scheduling tool or upgrade their BI platform and expect performance to improve on its own. It rarely does. The bottleneck is almost always the process, not the software.
What actually moves the needle is reducing decision latency, the gap between when data is ready and when a decision gets made. A report that takes five days to produce is not just slow. It means every decision made during those five days is based on older information. That is the real cost, and it is invisible on most IT dashboards.
I have also seen teams rush to automate before their KPI definitions are agreed upon. The result is automated reports that different departments read differently. Standardizing your KPI catalog before automation is not bureaucratic overhead. It is what makes AI-assisted reporting possible at all.
The last thing I will say is this: patience with incremental tuning pays off. Change one thing, measure it, then move to the next. It feels slow. It is actually the fastest path to a system you can trust.
— Christian
How Christiansteven accelerates your reporting performance
Christiansteven has spent over 20 years building scheduling and automation tools specifically for BI reporting teams. Its products, CRD for Crystal Reports, ATRS for Tableau, and PBRS for Power BI, handle the full cycle from data extraction through report generation to multi-format delivery. That covers the exact steps where most teams lose the most time.
The latest CRD release includes updated scheduling controls and delivery options that align directly with the optimization techniques covered here. Christiansteven's tools are SOC 2 Type II certified, come with a free trial, and are backed by a support team with a high Net Promoter Score. If you are ready to move from manual reporting to a fully automated pipeline, Christiansteven is a practical place to start.
FAQ
What is reporting system performance optimization?
Reporting system performance optimization is the process of improving the speed, accuracy, and scalability of data reporting through systematic techniques, including process mapping, template redesign, and automation.
How much time can automation save in reporting?
Automation can recover up to 40% of staff time and reduce report production time by up to 90%. One 2026 case study reduced quarterly report time from 5 days to 6 hours.
Why should I map processes before automating reports?
Automating without mapping first speeds up broken workflows and produces errors faster. The Map → Eliminate → Standardize → Automate sequence prevents this by removing inefficiencies before any automation is applied.
What metrics should I track to measure reporting optimization success?
Track delivery time, error rate, and user satisfaction. On-time delivery rates and error reduction percentages give the clearest picture of whether your optimization changes are working.
How does report design affect generation speed?
Reports exceeding 10,000 cells cause severe performance degradation according to Oracle's financial reporting documentation. Using dense column dimensions and sparse row dimensions reduces the number of MDX queries and speeds up generation significantly.