
Self-service BI reporting is defined as the practice of enabling non-technical business users to independently query, analyze, and visualize data without submitting requests to IT or a data team. The industry term for this practice is "self-service business intelligence," and it represents a fundamental shift in how organizations distribute data access. Traditional BI required a trained analyst to translate every business question into a report. Self-service BI removes that middleman entirely. ChristianSteven Software has built its reporting automation tools around this principle, helping teams get the right data to the right person without delays.
What is self-service BI reporting and how does it work?
Self-service BI reporting works by placing data query and visualization tools directly in the hands of business users through interfaces that require no coding skills. Instead of writing SQL, a sales manager can drag fields onto a canvas, type a plain English question, or click through a pre-built dashboard to get the answer they need.
Three core technologies make this possible:
- Natural language querying. Conversational BI interfaces understand plain English questions, removing the SQL skill barrier entirely. A user types "show me Q2 revenue by region" and the system returns a chart.
- Drag-and-drop report builders. Visual interfaces let users select dimensions and metrics from a governed list, then arrange them into tables or charts without writing a single line of code.
- Semantic or metric layers. These sit between the raw database and the user interface. They translate technical field names into business terms ("cust_rev_q2" becomes "Q2 Customer Revenue") and enforce consistent definitions across every report.
- Direct database connectivity. Modern self-service BI architectures connect directly to existing databases, cutting setup time from months to hours by avoiding data duplication and heavy ETL pipelines.
Pro Tip: Before selecting a self-service BI tool, confirm it supports a semantic layer. Without one, different teams will define the same metric differently, and your reports will contradict each other within weeks.
The most significant recent development is conversational AI. AI-powered conversational interfaces remove the traditional requirement to build reports manually, which has historically been the biggest adoption barrier for non-technical teams. When a user no longer needs to construct a report, they only need to ask a question. That shift alone accelerates adoption faster than any training program.

What are the benefits of self-service BI for organizations?
The primary benefit of self-service BI is speed. Report request queues that once ran one to four weeks collapse to minutes or hours when business users can query data themselves.
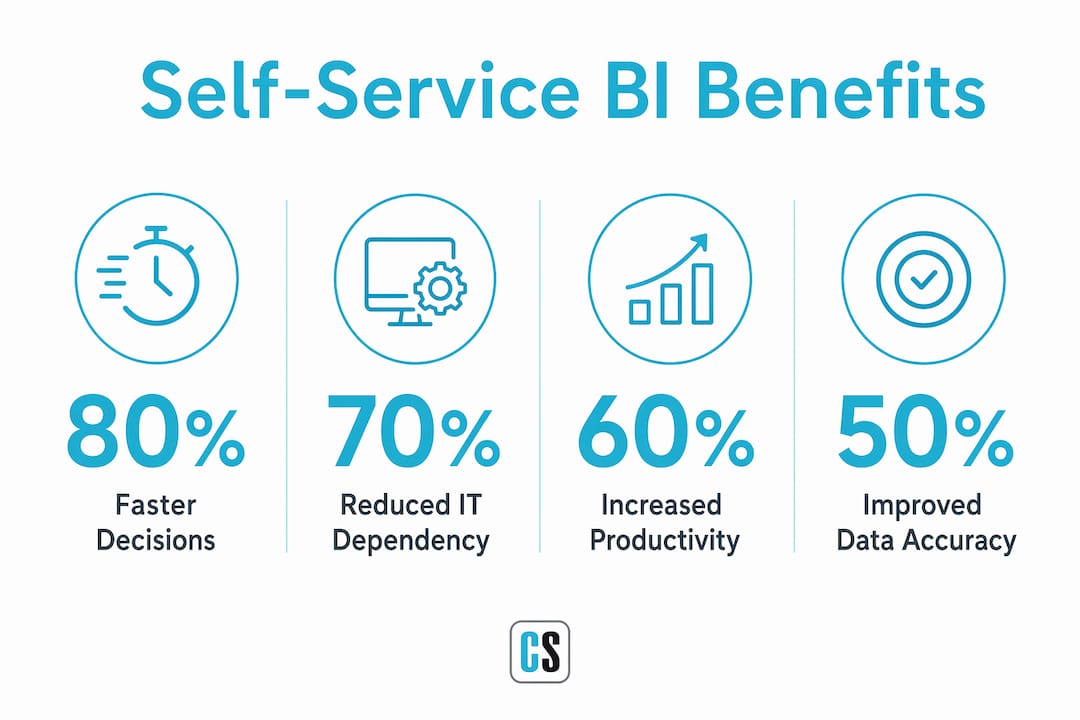
The efficiency gains are measurable. Self-service BI platforms reduce data team ad hoc request time by over 30% by shifting routine querying to business users. That means your analysts spend their time on complex modeling and strategic work, not pulling the same weekly sales report for six different managers.
The decision quality benefits are equally significant:
- Higher confidence. Employees empowered with data-literate tools are 50% more confident in their decisions. Confidence built on real data produces better outcomes than confidence built on gut instinct.
- Measurable enterprise value. That same data literacy links to a 3–5% increase in enterprise value. Organizations that treat data access as a competitive asset outperform those that treat it as an IT function.
- Decentralized agility. Marketing, finance, operations, and sales teams can each answer their own questions without waiting for a shared analyst queue. Departments move at their own pace.
- Reduced reporting backlog. IT and data teams stop being the bottleneck for every business question. They focus on infrastructure and governance instead of report production.
The shift from weeks to minutes is not a minor efficiency gain. It changes how decisions get made. A product team that can check customer behavior data in real time makes different choices than one waiting two weeks for a report. Self-service BI reporting turns data into a live input rather than a periodic summary.
You can read more about how self-service analytics tools directly improve team productivity and decision speed.
How is governance maintained in a self-service BI environment?
Governance is the part of self-service BI that most organizations underestimate. Giving everyone access to data sounds straightforward. Giving everyone access to accurate, consistent data requires deliberate architecture.
The core governance mechanism is role-based access control. Successful self-service BI organizations implement role-based and read-only access limits to prevent metric conflicts and protect data integrity. Users explore freely, but they cannot alter the underlying business logic. A regional sales director sees their territory's data. They cannot redefine how "revenue" is calculated.
The semantic layer is the second critical governance component. Without a governed semantic layer, self-service reporting creates uncontrolled spreadsheet proliferation with conflicting data versions. Every team ends up with their own definition of "active customer" or "monthly recurring revenue," and leadership meetings turn into arguments about whose numbers are right.
IT's role changes fundamentally in a self-service BI environment. Self-service BI shifts governance responsibilities to IT overseeing platform management, metric definitions, and security, rather than building every individual report. IT becomes a platform enabler, not a report factory.
| Governance component | Traditional BI approach | Self-service BI approach |
|---|---|---|
| Report creation | IT or analyst builds every report | Business user builds reports within governed parameters |
| Metric definitions | Defined per project, often inconsistent | Centralized in semantic layer, enforced platform-wide |
| Data access | Controlled by request queue | Role-based, read-only access by user or department |
| IT's primary role | Report production | Platform management and metric governance |
Pro Tip: Treat your semantic layer as a living document. Assign a data owner to each metric definition and schedule quarterly reviews. Outdated definitions cause the same problems as no definitions at all.
Data democratization depends on governed metrics and controlled user access, not unrestricted data exploration. The goal is not to give everyone access to everything. The goal is to give every person access to exactly what they need, defined consistently, with no ability to corrupt the source.
What practical steps support successful self-service BI adoption?
Successful adoption requires more than purchasing a tool. Self-service BI is a capability requiring a governed data foundation and user training. Software purchase alone does not produce operational self-service.
These steps build a foundation that actually works:
- Start with your semantic layer. Before users touch a report builder, define your core business metrics in one place. Revenue, churn, conversion, and margin must mean the same thing in every department.
- Choose interfaces that lower the skill barrier. Prioritize tools with natural language or conversational querying. The fewer technical skills required, the broader your adoption will be across the organization.
- Connect directly to your existing data sources. Avoid platforms that require you to copy data into a proprietary warehouse first. Direct connectivity reduces deployment time and keeps reports current.
- Match pricing to your organization's size. Smaller organizations face acute analyst bottlenecks and benefit most from flat or usage-based pricing models. Per-seat pricing that scales with headcount can make broad access unsustainable.
- Invest in training alongside technology. A drag-and-drop builder is only useful if users know what questions to ask. Short, role-specific training sessions build data literacy faster than documentation.
Understanding how to use data for insights is a skill that compounds over time. Teams that practice asking data questions regularly build intuition that improves every decision they make. The technology lowers the barrier. The culture determines whether teams actually walk through the door.
Self-service BI tools work best when the organization treats data access as a shared responsibility, not an IT service. That mindset shift is often harder than the technical implementation.
Key Takeaways
Self-service BI reporting delivers real value only when governed data infrastructure, role-based access, and user training support the technology.
| Point | Details |
|---|---|
| Core definition | Self-service BI lets non-technical users query and visualize data independently, without IT involvement. |
| Governance is non-negotiable | Role-based access and a semantic layer prevent conflicting metrics and protect data integrity. |
| Speed and confidence gains | Adoption reduces data team ad hoc workload by over 30% and increases employee decision confidence by 50%. |
| IT's role shifts | IT moves from report production to platform management and metric governance. |
| Capability, not just software | Successful self-service BI requires training and a governed data foundation, not just a tool purchase. |
Why most self-service BI rollouts fail in the first six months
I have watched organizations buy expensive BI platforms, run a two-hour onboarding session, and then wonder why nobody uses the tool three months later. The problem is almost never the technology.
The real failure point is treating self-service BI as a product rollout instead of an organizational capability. A license gives you access to a tool. It does not give your finance team the habit of asking data questions, or your operations manager the confidence to trust a number they pulled themselves. Those things take time and deliberate effort.
The second failure pattern I see consistently is skipping the semantic layer because it feels like extra work upfront. Teams go live with raw database access, every department starts defining metrics their own way, and within weeks the leadership team is arguing about whose revenue number is correct. That argument destroys trust in the entire system faster than any technical failure.
The organizations that get self-service BI right treat the governed metric library as the product, not the dashboard. They spend the first month defining what "customer," "revenue," and "active user" mean before anyone builds a single report. That foundation makes everything downstream reliable.
Conversational AI interfaces have genuinely changed the adoption curve. When a user can type a question in plain English and get a chart back in seconds, the "I don't know how to use this" objection disappears. The build step was always the biggest barrier. Removing it changes who participates in data-driven decisions.
— Bobbieann Gordon
How ChristianSteven Software supports your BI reporting workflows
ChristianSteven Software automates the delivery side of BI reporting, ensuring that the right reports reach the right people at the right time without manual intervention.
For teams running Tableau, ATRS automates Tableau report delivery by scheduling, formatting, and distributing reports automatically across your organization. No one waits for a colleague to remember to send the Monday morning dashboard. For teams that need real-time KPI visibility, IntelliFront BI provides integrated dashboards and analytics that connect directly to your data sources. ChristianSteven Software has delivered reliable BI automation for over two decades, backed by SOC 2 Type II certification.
FAQ
What is self-service BI reporting in simple terms?
Self-service BI reporting is a method that lets business users query data and build reports on their own, without needing IT or a data analyst to do it for them. It uses visual interfaces, natural language querying, and governed data layers to make data access practical for non-technical teams.
How does self-service BI differ from traditional BI?
Traditional BI requires users to submit report requests to IT or an analyst, creating queues that can run one to four weeks. Self-service BI gives users direct access to governed data through interfaces that require no coding, cutting that wait to minutes.
What is the biggest risk of self-service BI reporting?
The biggest risk is uncontrolled data access without a governed semantic layer, which leads to conflicting metric definitions across departments. Role-based access controls and centralized metric definitions prevent this problem.
Do you need technical skills to use self-service BI tools?
Modern self-service BI tools with natural language and drag-and-drop interfaces require no SQL or coding skills. Conversational AI interfaces let users ask plain English questions and receive charts or tables instantly.
How long does it take to implement self-service BI reporting?
Platforms that connect directly to existing databases can reduce setup time from months to hours by avoiding data duplication. The technical setup is fast; building the governed semantic layer and training users takes longer and determines whether adoption succeeds.