Coordinating business reporting across teams and data sources creates scheduling gaps, metric drift, and manual delivery work. Most tools limit automation or require costly per-user licensing that blocks global scaling or SAP integration. This comparison weighs integration scope, automation scale, and pricing so organizations can pick a reporting automation platform that fits their needs.
Table of Contents
ChristianSteven Software
At a Glance
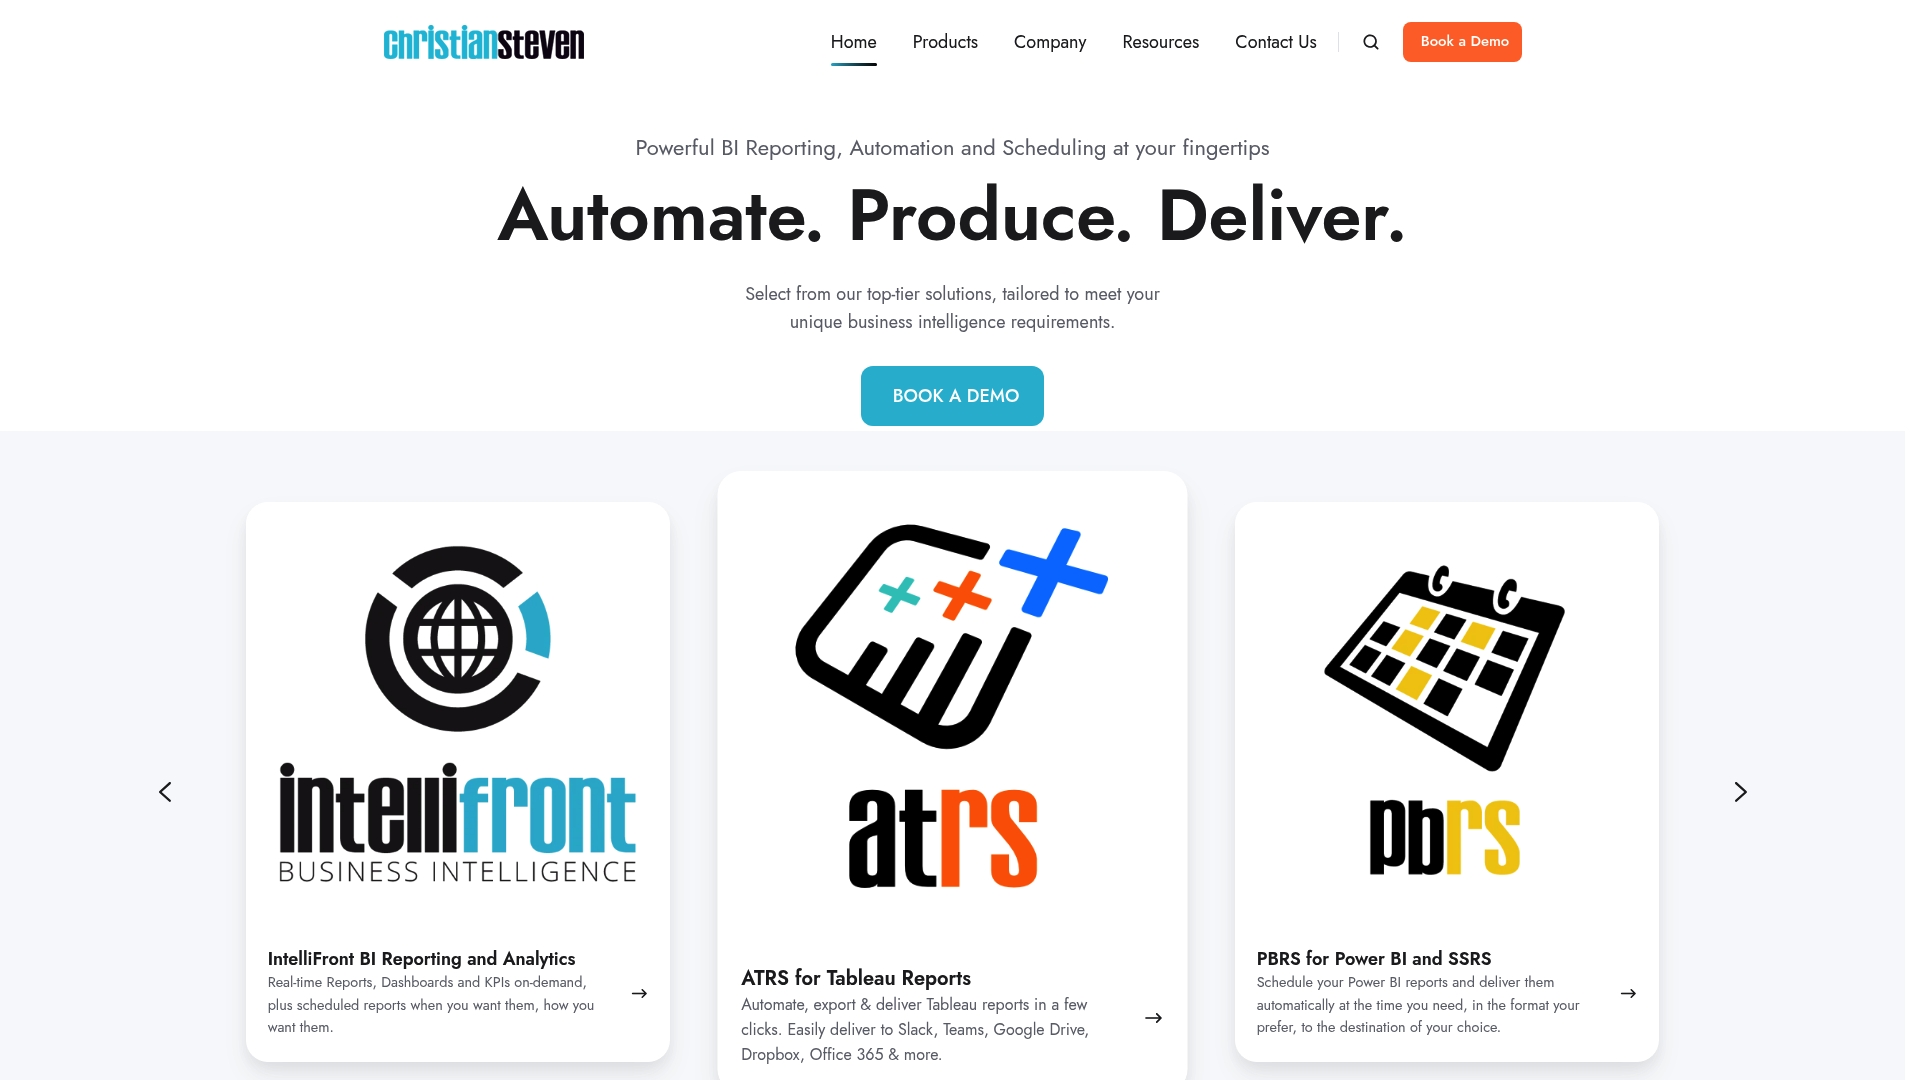
The vendor reports serving nearly 5,000 clients across 47 countries. The company also reports a Net Promoter Score of 82 in 2025 and a customer satisfaction rate of 96.1%. ChristianSteven Software has offered BI reporting and automation since 2002 and highlights report schedulers plus a real-time BI platform.
Core Features
ChristianSteven Software packages report scheduling for Tableau, Power BI, and Crystal Reports while supporting delivery to email, cloud storage, and applications. The offering includes real-time dashboards and business process automation for BI workflows, and it ships with free trials and a simple deployment path. The product set includes PBRS for Power BI and IntelliFront BI for real-time KPIs, and it supports unlimited users with automatic report delivery.
Key Differentiator
The combination of formal SOC 2 Type II certification, a track record spanning more than 20 years, and licensing that includes unlimited access in pricing sets this vendor apart. That mix targets organizations that need audited security controls plus a predictable rollout model for large teams.
Pros
Long tenure in BI reporting gives the company deep operational experience with scheduling and distribution across common enterprise tools. That NPS score and the reported satisfaction rate signal strong client retention and practical reliability. Security is explicit through the declared SOC 2 Type II status, and pricing covers licenses and support so administrators do not manage per-seat billing. Free trials and flexible deployment lower the barrier to test scale in a production environment.
Cons
- Pricing based on production usage may make costs less predictable for very small organizations.
Notable Integrations
- Tableau
- Power BI
- Crystal Reports
- SQL Server Reporting Services
Who It's For
Large enterprises and midmarket organizations with complex reporting needs and global teams will find the platform fits their scale. IT and reporting operations that require audited security controls and delegated report delivery will benefit most. Small firms with a handful of simple reports may find the feature set heavier than necessary.
Unique Value Proposition
Unlimited licensing included in pricing lets global BI teams deploy widely without per-seat negotiations. That pricing model reduces license administration and removes a common barrier when rolling out report automation across departments. For organizations balancing audited security and broad access, this approach lowers operational friction.
Real World Use Case
A multinational corporation uses the vendor's PBRS scheduler to automate Power BI report distribution across regional offices. Reports arrive on schedule in local mailboxes and shared cloud folders, removing manual steps and accelerating decision cycles. The implementation also supports compliance needs through the declared SOC 2 Type II controls.
Pricing
Pricing is usage or installation based with no extra charges for features, users, or support. The vendor states that sensible pricing covers unlimited licenses and included support, which simplifies budget conversations for enterprise deployments.
Website: https://christiansteven.com
Pyramid Analytics
At a Glance
Pyramid Analytics reports more than 250 built in connectors for direct access to enterprise sources. The platform combines data preparation, data science, and visualization in one product. Deployment works on premise, in the cloud, or in hybrid setups. That flexibility makes it practical for regulated environments with strict data control.
Core Features
The platform offers data preparation and data science workflows alongside a fast direct query engine that connects to many sources. It presents a virtual semantic model to simplify complex analysis and centralize business logic. Users can explore data with interactive discovery tools and collaborate with annotations, comments, and data snapshots while applying role based access control.
Key Differentiator
The standout capability is a unified AI driven environment that ties data prep, semantic modeling, and analytics together under enterprise governance. That approach lets data teams build a single semantic layer and push consistent metrics across reports. For organizations that must centralize definitions, this reduces metric drift and audit effort.
Pros
Strong governance and data integrity features make metric management predictable. Administrators can centralize business logic and control access with role based controls, which helps audits and compliance workflows. Report automation and distribution reduce manual report handoffs and speed scheduled delivery. Producing publication ready reports requires less design work than many server side alternatives. Flexible deployment options let teams match architecture to security policies.
Cons
- Steeper learning curve for new users compared with lightweight visualization tools.
- Advanced customization and visualization polish are more limited than some specialist tools.
- Predictive analytics depth does not match leading data science platforms.
- Dashboard visual appeal is rated lower by users who prioritize highly styled visuals.
When It May Not Fit
Teams that need rapid, low friction self service exploration may find the learning curve too high. Organizations that rely on advanced visual design or cutting edge predictive models will miss depth and polish. Small teams with minimal governance requirements will likely prefer lighter, faster tools.
Notable Integrations
Pyramid connects to major enterprise data stacks, including SAP, Snowflake, Azure Synapse, Google BigQuery, and Kubernetes. Those integrations support hybrid and cloud deployments and let teams run queries close to the source. The connector list aligns with common enterprise architectures.
Who It's For
Large organizations and centralized data teams that need strict governance, consistent metrics, and controlled access. IT leaders who must enforce a single semantic model while supporting both analysts and business report consumers will find value. Regulated industries that require on premise or hybrid deployment are a natural fit.
Real World Use Case
A healthcare system used Pyramid to combine clinical, financial, and operational data sources. The team built a governed semantic layer and published secure dashboards for clinicians and operations staff. Scheduled reporting and role based access helped deliver the right views to each user group while preserving audit trails.
Pricing
Pyramid Analytics uses custom pricing based on organizational needs. The vendor asks prospects to request a quote so pricing scales to deployment type, connector volume, and user roles. Contact sales for an estimate tailored to your environment.
Website: https://pyramidanalytics.com
SAP Analytics Cloud
At a Glance
Supports large scale data modeling and a data fabric architecture for enterprise deployments. The platform pairs that architecture with real time analytics and AI driven features for predictive forecasting. Large organizations use those capabilities to unify SAP and third party sources for consolidated reporting.
Core Features
The tool delivers continuous real time data analysis alongside visualization and dashboarding tools for executive and operational views. It connects to SAP systems and third party data sources, and it automates parts of data modeling and preparation to reduce manual mapping work. The platform also supports large scale models that fit enterprise data fabrics and multi domain reporting needs.
Key Differentiator
SAP Analytics Cloud stands out for its deep SAP ecosystem integration combined with enterprise focused AI and live analytics. That mix lets teams move from source systems to decision ready dashboards without rebuilding models for each report. Organizations already invested in SAP infrastructure will see the strongest alignment with this approach.
Pros
Strong connectivity with SAP landscapes simplifies access to ERP and financial sources and cuts the time to integrated reporting. Real time data analysis supports operational dashboards and faster incident response for operations and supply chain teams. Automated data modeling reduces repetitive ETL work, and the platform includes security and compliance features that enterprise IT teams expect.
Cons
- Steep learning curve that requires considerable user training.
- Higher costs compared with some competitors, which may put smaller teams at a disadvantage.
- Occasional performance problems when handling very large or non SAP data sets.
- Limited flexibility for some visualization and report customization choices.
When It May Not Fit
If your organization lacks the budget for enterprise licensing, this product may be too costly. Small to medium sized teams without dedicated BI administrators will struggle with the training demands. If most of your data lives outside SAP and performance matters, a lighter tool may suit you better.
Who It's For
Large enterprises and divisions running SAP ERP or S4HANA that need unified reporting across operations, finance, and supply chain will benefit most. Data teams that can allocate training and governance resources will extract more value. Organizations seeking out of the box, low cost BI for small teams will find it an awkward fit.
Real World Use Case
A multinational manufacturer consolidates operational, supply chain, and financial feeds from SAP and non SAP systems into live dashboards for plant managers and CFOs. The environment runs predictive maintenance models and pushes forecasts to dashboards for daily planning. That setup reduces manual report handoffs and shortens decision cycles across divisions.
Pricing
SAP does not publish standard list pricing for this product. Costs vary by modules, deployment scope, and number of seats and are negotiated through SAP sales channels. Not applicable — informational only.
Website: https://sap.com/products/analytics.html
Comparison of Alternatives
When comparing options for BI reporting and automation platforms, differences in licensing models and governance capabilities play defining roles.
Licensing Models
ChristianSteven Software provides unlimited user licensing included in its pricing, which benefits organizations planning for high-scale deployments where managing per-user fees could become cumbersome. In contrast, Pyramid Analytics and SAP Analytics Cloud rely on tailored pricing structures that adapt to deployment size and features, posing potential challenges for teams needing upfront cost predictability.
Governance and Integration
Pyramid Analytics excels in enterprise governance with its unified semantic model that facilitates centralized metrics and enhances compliance workflows. This capability is for organizations prioritizing strict oversight over reporting definitions. SAP Analytics Cloud, while acclaimed for its synchronization with SAP environments, offers real-time dashboards and predictive analysis integrated tightly within its ecosystem. ChristianSteven Software focuses primarily on task automation and scheduling flexibility but lacks the deep governance layered controls seen in Pyramid Analytics.
Best Fit
- Extended enterprise teams requiring cost-effective widespread user access will benefit most from ChristianSteven Software.
- Regulated industries needing centralized semantic layers for compliance workflows should consider Pyramid Analytics.
- SAP-focused organizations aiming for consolidated dashboards integrated with ERP and operational systems will find SAP Analytics Cloud advantageous.
Our Pick
ChristianSteven Software achieves a critical balance for large enterprises seeking predictable costs paired with scheduling tools and security certifications. With unlimited user inclusion, it alleviates administrative overhead tied to licensing while delivering effective BI automation. However, teams needing advanced semantic modeling or predictive analytics may prefer Pyramid Analytics or SAP Analytics Cloud, respectively.
The table below compares alternatives for business intelligence reporting automation focused on ease of integration, user scalability, and core functionality.
| Tool | Core Feature | Best For | Pricing | Notable Limitation |
|---|---|---|---|---|
| ChristianSteven Software | Unlimited user reporting automation | Large teams requiring SOC 2 certification and scalability | Price not published | Higher costs might impact smaller organizations. |
| Pyramid Analytics | Semantic model for unified analytics | Centralized teams needing governance and precise metrics | Price not published | Advanced user training required. |
| SAP Analytics Cloud | Real-time analysis within SAP systems | Enterprises leveraging SAP infrastructure for data analysis | Price not published | Limited ease for non-SAP system compatibility. |
Finding Reliable tableau.com Alternatives for Business Reporting
Choosing the right tableau.com alternative can be challenging for large organizations with complex reporting needs. ChristianSteven Software solves this by automating business intelligence reporting across Power BI, Tableau, Crystal Reports, and more. Its SOC 2 Type II certification and unlimited user licensing remove common barriers for global BI teams who require audited security and scalable report delivery.
ChristianSteven Software helps teams automate scheduling and distribution, so reports and dashboards always reach the right people in the correct format and on time. See how ChristianSteven Software provides consistent reliability and simplifies enterprise deployments with solutions like PBRS and IntelliFront BI.
Learn more about ChristianSteven Software and start automating your BI reports to reduce manual workflows and accelerate decision making.
FAQ
What reporting automation features does ChristianSteven Software offer?
ChristianSteven Software provides report scheduling for popular BI tools like Tableau, Power BI, and Crystal Reports. The software supports delivery to email, cloud storage, and applications, making it versatile for various business environments.
How does pricing for ChristianSteven Software compare to Pyramid Analytics?
Pyramid Analytics customizes pricing based on deployment type and user roles, which may vary significantly depending on organizational needs. In contrast, ChristianSteven Software offers unlimited licensing included in its pricing, simplifying the budgeting process and removing per-seat billing complexities.
Can I automate report delivery with ChristianSteven Software?
Yes, ChristianSteven Software facilitates automated report delivery through its PBRS for Power BI, allowing for seamless distribution across teams. This capability helps reduce manual report generation and speeds up decision-making processes in business operations.
What is the benefit of SOC 2 Type II certification for ChristianSteven Software?
The SOC 2 Type II certification ensures that ChristianSteven Software has passed rigorous security audits, which is vital for organizations needing audited security controls. This compliance provides peace of mind to businesses concerned about data security and operational integrity.
Does ChristianSteven Software support real-time dashboards?
Yes, ChristianSteven Software includes real-time dashboards that provide immediate insights into business data, aiding in more informed decision-making. This feature is crucial for organizations that require up-to-date information across their operations.