
A BI reporting pipeline is defined as an end-to-end framework that collects raw operational data, transforms it, and delivers finished reports and dashboards to decision-makers reliably and on schedule. The term "BI reporting pipeline" is widely used in practice, though the recognized industry term is the business intelligence data pipeline. Both refer to the same structured system. Understanding this pipeline is the difference between organizations that trust their numbers and those that argue about them in every meeting.
The pipeline spans 4 to 6 architectural layers: data sources, ETL/ELT processing, storage, a semantic layer, analytics tools, and dashboards. Each layer has a specific job, and a failure in any one of them corrupts everything downstream. ChristianSteven Software builds automation around this exact pipeline structure, ensuring reports reach the right people at the right time without manual intervention.
What is a BI reporting pipeline made of?
A BI reporting pipeline connects raw source data to finished business intelligence reporting through a series of defined layers. Each layer transforms or governs the data before passing it forward.

Data sources
Every pipeline starts with source systems. These include ERP platforms like SAP, CRM systems like Salesforce, IoT sensor feeds, flat files, and cloud databases. The diversity of these sources is the first challenge. A single organization may pull data from a dozen systems that were never designed to talk to each other.
Data ingestion and integration
The ingestion layer uses ETL (extract, transform, load) or ELT (extract, load, transform) processes to pull data from those sources and move it into a central location. BI data integration at this stage determines whether downstream reports reflect reality or a distorted version of it. ELT has become more common as cloud warehouses grow powerful enough to handle transformation at scale.
Storage: warehouse vs. lakehouse
Transformed data lands in a data warehouse or a data lakehouse.
| Storage Type | Best For | Typical Use Case |
|---|---|---|
| Data warehouse | Structured, governed reporting | Financial dashboards, KPI summaries |
| Data lakehouse | Mixed structured and unstructured data | Advanced analytics, machine learning |
| Operational database | Real-time transactional queries | Live sales feeds, inventory tracking |
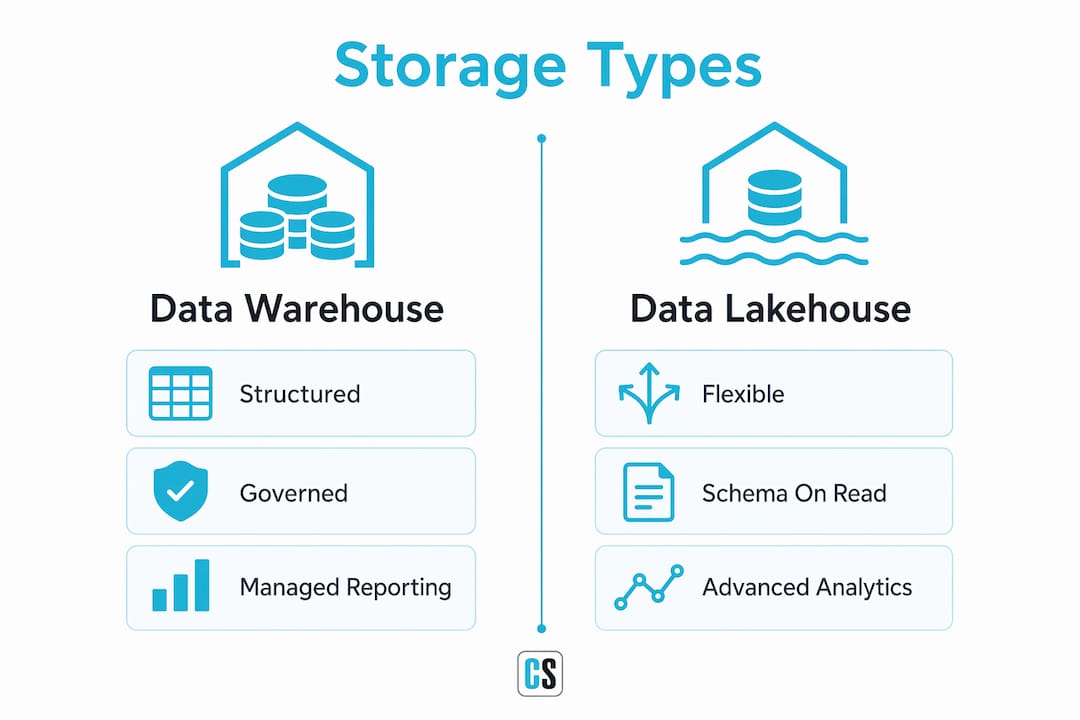
Warehouses enforce strict schemas, which makes them reliable for managed reporting. Lakehouses offer more flexibility for teams that also run exploratory analysis alongside scheduled reports.
The semantic layer
The semantic layer sits between storage and the reporting tools. It translates technical field names and database logic into business language. "Net revenue" means the same thing in finance, sales, and operations because the semantic layer defines it once and enforces it everywhere. Without semantic modeling, different teams calculate the same metric differently, and conflicting reports destroy trust in the entire system.
Reporting and dashboard layers
The final layer is where analysts and executives interact with the data. This includes scheduled managed reports, self-service dashboards, and ad hoc query tools. The BI tool is only the front-end. The pipeline's strength lies in the back-end transformation, cleaning, and modeling that makes those front-end outputs trustworthy.
How does the BI reporting process ensure data quality and governance?
Data quality and governance are not optional features of a BI pipeline. They are the conditions that make the pipeline worth running.
The semantic layer is the primary governance mechanism. Standardized KPIs with clear ownership cut confusion and build trust in metrics across departments. Governance also includes access controls that determine who sees which data, metric definitions that prevent competing interpretations, and data lineage documentation that traces every number back to its source.
Without governance, data silos form. Each department builds its own version of the truth, and leadership ends up with three different revenue figures on the same day. That is not a data problem. It is a governance failure.
Automated reconciliation is the second line of defense. Reconciliation checks compare report outputs against source system values at every refresh cycle. Reconciliation at every refresh prevents incorrect data from circulating and damaging operations before anyone notices the error.
Best practices for maintaining a trusted single source of truth include:
- Assigning a named owner to every KPI and metric definition
- Documenting data lineage from source system to final report
- Enforcing role-based access controls at the semantic layer
- Running automated reconciliation checks after every pipeline refresh
- Auditing unused reports quarterly and retiring those that no longer serve a decision
Pro Tip: Set up alerting on your reconciliation checks so that a failed validation triggers a notification before any report is distributed. Catching errors before delivery is far cheaper than correcting decisions made on bad data.
What are the steps to build and maintain a BI reporting pipeline?
Building a BI reporting pipeline follows a defined lifecycle. The process involves eight key steps, from initial assessment through continuous iteration. Skipping early steps creates technical debt that compounds over time.
-
Assess data maturity. Catalog your existing data sources, identify gaps, and evaluate the quality of what you already have. You cannot build a reliable pipeline on top of unreliable source data.
-
Define objectives and KPIs. Identify which business decisions the pipeline must support. Building pipelines backward from business decisions ensures every report serves an operational need rather than existing for its own sake.
-
Connect and prepare data sources. Configure ingestion from each source system. Apply data cleaning rules, handle null values, and standardize formats before data enters the warehouse.
-
Build the semantic layer. Define business terms, metric calculations, and access rules in a centralized model. This step is the most frequently skipped and the most consequential. Teams that skip it spend months resolving metric conflicts later.
-
Design and develop reports. Build reports and dashboards aligned with the decisions identified in step two. Involve the end users who will act on these reports during the design phase, not after launch.
-
Automate refresh and delivery schedules. Configure the pipeline to refresh data and distribute reports on a defined cadence. Automation removes manual steps that introduce delays and errors. Tools like ChristianSteven Software's PBRS for Power BI and ATRS for Tableau handle this layer directly.
-
Test and validate outputs. Run reconciliation checks against source systems. Confirm that calculated metrics match expected values before releasing reports to production.
-
Iterate based on usage and feedback. Monitor which reports are accessed, which are ignored, and which generate questions. Treat the pipeline as a living product. Retire reports that no longer serve a decision and add new ones as business needs evolve.
How do BI reporting pipelines support different reporting needs?
A well-built data pipeline for reporting serves two distinct use cases, and conflating them is a common mistake.
BI reporting is structured, repeatable data delivery. Managed reports run on a schedule: a weekly financial dashboard, a daily operational KPI summary, a monthly board pack. These reports answer known questions with consistent data. The pipeline automates their production and delivery so that no analyst has to manually export and email a spreadsheet.
Ad hoc reporting is different. It supports on-demand queries where a decision-maker needs to answer a question that was not anticipated in advance. A well-governed pipeline enables self-service analytics by exposing the semantic layer to query tools, so users can explore data without breaking the governed definitions underneath.
The practical distinction matters for pipeline design:
- Managed reports require scheduled refresh, version control, and automated distribution
- Ad hoc queries require a governed semantic layer and appropriate access controls
- Both require the same underlying data quality and transformation standards
Failure to connect reports to decision workflows leads to low dashboard adoption. Reports that exist without a clear decision owner get ignored. Measuring report usage and tying each report to a named business decision are the two practices that separate pipelines with high adoption from those that become shelfware.
Understanding the various applications of BI solutions helps teams decide which reporting type to prioritize at each stage of pipeline maturity. Establishing clear KPI measurement practices before building reports also prevents the common trap of tracking metrics that no one acts on.
Key Takeaways
A BI reporting pipeline delivers trustworthy business intelligence only when governance, semantic modeling, and automated delivery work together across every layer.
| Point | Details |
|---|---|
| Pipeline definition | A BI reporting pipeline spans data ingestion, transformation, semantic modeling, and automated report delivery. |
| Governance is non-negotiable | Without standardized KPIs, access controls, and data lineage, conflicting reports will undermine decisions. |
| Build backward from decisions | Define the business decision first, then design the report and pipeline to support it. |
| Automate refresh and delivery | Manual report distribution introduces delays and errors that automation eliminates entirely. |
| Treat the pipeline as a product | Monitor usage, retire unused reports, and iterate based on real decision-making needs. |
The part most teams get wrong about BI pipelines
After working with data teams across industries, the pattern I see most often is this: organizations invest heavily in the front-end BI tool and almost nothing in the semantic layer. They buy a visualization platform, connect it directly to a warehouse, and call it a pipeline. Then they wonder why finance and sales are arguing about revenue figures every quarter.
The semantic layer is not a nice-to-have. It is the mechanism that makes every report in the organization mean the same thing. When I see a team skip it, I know they will rebuild their entire reporting stack within two years. The cost of that rebuild always exceeds the cost of doing it right the first time.
The second mistake is building pipelines forward from data rather than backward from decisions. A team catalogs its available data, builds every report it can imagine, and then measures success by the number of dashboards created. Dashboard count is not a success metric. Decision support is. I have seen organizations with 400 active reports where executives still make major calls based on gut instinct because none of those reports answered the right question.
The fix is straightforward. Before writing a single line of transformation logic, name the decision the report must support and name the person who will make that decision. Everything else follows from that. Pipelines built this way get used. Pipelines built the other way get abandoned.
Evaluating whether your current setup is actually serving your needs is the honest first step most teams skip.
— Bobbieann Gordon
How ChristianSteven Software fits into your reporting pipeline
ChristianSteven Software automates the delivery layer of your BI reporting pipeline, the step where most manual effort and error accumulates.

PBRS for Power BI, ATRS for Tableau Reports, CRD for Crystal Reports, and IntelliFront BI each handle a specific part of the reporting stack. They automate report scheduling, formatting, and distribution so that the right report reaches the right person at the right time without manual steps. ChristianSteven Software holds SOC 2 Type II certification, which means the automation layer meets the security and reliability standards enterprises require. For teams running Tableau, the Tableau report scheduler handles automated delivery at scale, removing the last manual bottleneck in an otherwise governed pipeline.
FAQ
What is a BI reporting pipeline in simple terms?
A BI reporting pipeline is the end-to-end system that moves data from source systems through transformation and storage into finished reports and dashboards. It automates the process so that decision-makers receive accurate, up-to-date information on a defined schedule.
What is the difference between a data pipeline and a BI reporting pipeline?
A data pipeline moves and transforms data between systems for any purpose. A BI reporting pipeline is a data pipeline specifically designed to produce governed, business-ready reports and dashboards for decision support.
Why does the semantic layer matter in a BI pipeline?
The semantic layer defines business terms and metric calculations once, then enforces them across every report. Without it, different teams calculate the same metric differently, producing conflicting reports that erode trust in the entire BI system.
How often should a BI reporting pipeline refresh data?
Refresh cadence depends on the decision the report supports. Financial dashboards may refresh daily or weekly, while operational KPI reports may refresh hourly. The pipeline should match the decision cycle, not default to the fastest technically possible interval.
What causes low dashboard adoption in BI pipelines?
Low adoption results from reports that are not connected to a specific business decision or decision-maker. Building pipelines backward from decisions and assigning a named owner to each report are the two practices that drive consistent usage.