
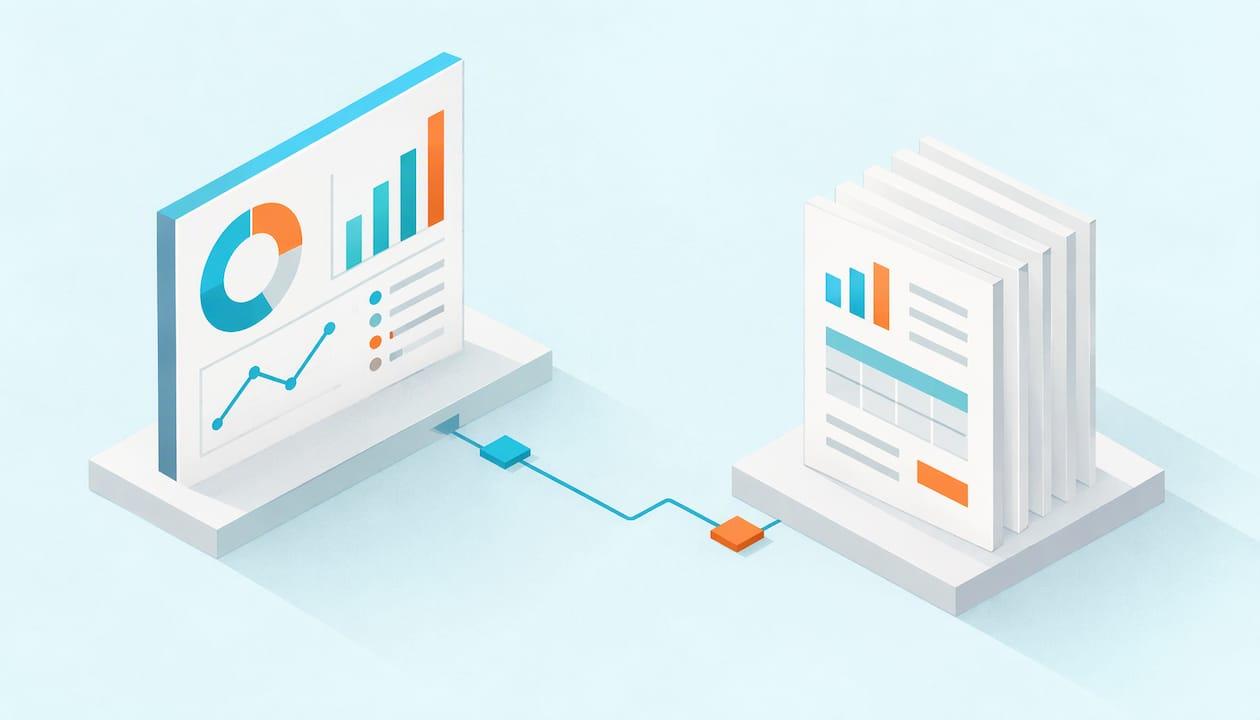
A dashboard tells you whether something needs attention. A report tells you why and gives you the detail to act. Use a dashboard when people need to monitor a handful of metrics at a glance, and a report when they need to look up, verify or hand over specific facts. The main condition that changes this: in tools like Power BI, Tableau, SSRS and Crystal Reports the words overlap, so the label on the file matters less than how people consume it. If a "dashboard" gets exported to PDF every Monday, it is working as a report, and it needs report-style delivery.
This article draws the line, shows where the tools blur it, and follows one illustrative business situation to the point where delivery, not design, decides the outcome.
Table of Contents
- What a dashboard is and what a report is
- The differences that affect your decision
- One business situation to carry through
- Where the tools blur the line
- Real-time dashboards or scheduled reports
- When your existing tools are enough
- The requirement that justifies another approach
- How the scenario works with automation
- How to decide: a short procedure
- Delivering dashboards, not just reports
- Put delivery on a schedule
- Our perspective
- FAQ
What a dashboard is and what a report is
The cleanest definition comes from a university data team. UCI Data Central describes a dashboard as a visual display of the most important information needed to reach one or more objectives, consolidated on a single screen for at-a-glance monitoring. A report, in the same source, helps people look up the facts needed for the task at hand. It may combine charts, tables and filtering prompts, and it can be a printable artifact to share with stakeholders.
The same page offers a car analogy that sticks. The check-engine light grabs your attention but does not say what is wrong. The mechanic's diagnostic printout, with fault codes and sensor readings, is what solves the problem. The dashboard monitors. The report interprets.
G2's glossary frames it similarly: a report is an in-depth look at one element of business performance, often a snapshot at a particular time with data you can sort, group or filter. A dashboard is an overview of crucial metrics and trends, and its visuals connect to a deeper report.
The differences that affect your decision
Most comparison pages list a dozen differences. Only a few change what you build or how you deliver it.
| Factor | Dashboard | Report |
|---|---|---|
| Main job | Monitor and spot exceptions | Explain, verify, document |
| Layout | One screen, few visuals | Often several pages, tables and detail |
| Reader's question | "Is anything off?" | "What exactly happened, and for whom?" |
| Interactivity | Usually light, mostly clicks into detail | Filtering, drill-through, sorting |
| Typical output | A live view in the BI portal | PDF, Excel or a printed page |
| Audience | Managers watching trends | Analysts, finance, auditors, external parties |
DataCamp's Power BI guide draws the same split: dashboards are typically single-page, near-real-time views with limited interactivity, while reports can span several pages, offer drill-through and filtering, and often work from historical data that is refreshed periodically.
Two differences matter most when you plan delivery. First, who needs to act on the content: someone who only needs a signal can live with a dashboard, but someone who must reconcile numbers needs a report with exact rows. Second, whether the output has to leave the BI tool: attachments, files on a share, or an email to a person without a login are report behavior, whatever you called the original.
One business situation to carry through
The following scenario is illustrative, not a customer story.
A regional sales director, Dana, runs five regions. Every Monday at 7:30 a.m. she wants to know two things: did any region fall below its weekly target, and if so, which accounts drove the miss. Each regional manager needs only their own region's numbers. The CFO wants a month-end PDF of the same data for the board pack, formatted identically every month.
That is three needs, not one:
- Dana needs a dashboard view: five regions, target versus actual, a red flag where something slipped.
- Each regional manager needs a report: account-level detail, filtered to their region.
- The CFO needs a report as a fixed-layout PDF, delivered on a schedule.
The analytics team could build all three from the same dataset. The design work is the easy part. The hard part is getting the right version to the right person at 7:30 on Monday, every Monday, without an analyst exporting files by hand.
Where the tools blur the line
If you work in Power BI, you have noticed the vocabulary is specific. In Power BI, a report sits on a dataset and is built to explore and analyze. A dashboard is a single page of tiles pinned from one or more reports, available in the Power BI service. Tableau calls its main objects workbooks, with dashboards and sheets inside. SSRS and Crystal Reports are report-first tools, built around paginated, print-ready layouts. So in SSRS or Crystal, the "report" is the deliverable. In Tableau, a "dashboard" is often an interactive page that people also export.
The practical rule: ignore the tool's label and ask two questions about each item. Does the reader need to scan it or look things up? Does it need to arrive as a file or email? Your answers tell you whether to design for glanceability, for detail, or for both with a link between them.
For a deeper look at how Power BI treats reports specifically, our post on Power BI and Power BI reports covers the basics.
A note on design: a dashboard is only as useful as the metrics chosen for it, and peer comparison is a common way to pick them. A benchmarking dashboard design example from recruiting shows how a few well-chosen measures can be set against peer data on one screen.

Real-time dashboards or scheduled reports
Use a live dashboard when the decision loses value as time passes: a support queue, a production line, a trading desk. Use a scheduled report when the decision happens on a calendar: weekly sales reviews, month-end close, compliance submissions, board packs.
A scheduled report has three advantages that live views lack. It is a fixed record, so the number Dana saw Monday is still the number on Tuesday. It reaches people who never open the BI portal. And it can be personalized per recipient before it goes out.
Be careful with the word "real-time." A dashboard is only as current as its data refresh. If the underlying dataset refreshes nightly, the screen is a nightly view, however polished it looks. ExcelDemy's explainer makes the same point about Power BI alerts: they re-evaluate when the dataset refreshes, so a nightly refresh means an alert can fire at most once a day, whatever frequency you set. For a Monday-morning decision, that is perfectly fine. For an intraday decision, it is not.
For Dana, the answer is both. Her Monday check is a scheduled delivery, because she decides on a weekly rhythm. Nobody needs a second-by-second view of weekly targets.
When your existing tools are enough
If your audience is small, everyone has a BI login, and they are content to open a link, built-in features cover you. Power BI email subscriptions send automatic deliveries of report pages or dashboard snapshots at hourly, daily, weekly, monthly or after-refresh frequencies, according to this setup guide. Page subscriptions deliver a snapshot of one report page with an optional link to the full report. Dashboard subscriptions deliver a snapshot of the full dashboard or selected tiles. Recipients do not need a Power BI license, though the subscription owner does.
The same ExcelDemy piece reports a cap of 24 subscriptions per report or dashboard, each with its own recipients and schedule, and says subscriptions respect sharing permissions and row-level security. Row-level security (RLS) is the rule set that limits which rows each person can see.
If Dana's team were three people, that might be the end of the story. Our walkthrough of Power BI email subscriptions shows how far the built-in feature goes.
The requirement that justifies another approach
Native subscriptions send a snapshot, an image and a link. Trouble starts when the requirement list looks like this:
- Hundreds of recipients, each needing different filter values
- Output as Excel or PDF attachments, not images
- Delivery to a file share, cloud folder, database or collaboration tool, not only inboxes
- Sends triggered by an event, such as a data load finishing, not a clock
- Recipients outside your organization
- Retries and error handling when a send fails
Personalization is the first wall most teams hit. Standard subscriptions send the same content to a list of addresses. Data-driven subscriptions, where a dataset decides the recipients and parameter values, so each regional manager gets only their region, require Power BI Premium according to one 2026 guide, which also notes that paginated reports suit scheduled email delivery and pixel-perfect layout better than interactive reports. Check your own licensing against Microsoft's current documentation before you design around it, since editions change.
When Dana's five managers become fifty, and the CFO's PDF has to land on a share as well as in an inbox, you have outgrown the snapshot model. That is the moment to look at report automation software.
How the scenario works with automation
Here is how Dana's three needs map to ChristianSteven products. Each product has a specific role.
- Power BI or SSRS reports: PBRS schedules, personalizes, exports, packages and delivers Power BI and SSRS content. For Dana, it bursts one report across five regions using data-driven schedules, so each manager receives their own slice as a PDF or Excel file.
- Tableau Cloud: if the same dashboards live in Tableau Cloud, ATRS handles the scheduling and delivery of Tableau reports.
- Crystal Reports: CRD does the same for Crystal Reports, which matters if the CFO's month-end layout is a legacy Crystal file.
- Self-hosted dashboards: IntelliFront BI serves self-hosted dashboards, KPIs and centralized reporting access, so Dana's at-a-glance view and the underlying reports sit in one place.
The expected result: the Monday dashboard view is waiting, each manager's region report arrives in the format they asked for, and the CFO's PDF goes out in the same layout each month. Nobody exports anything by hand, and nobody files a help desk ticket asking for a rerun.
To configure filtered delivery in Power BI, see our guide on subscribing to Power BI reports with filters. For the mapping logic and limits behind per-recipient sends, read about Power BI dynamic subscriptions.
How to decide: a short procedure
Run this for each item on your reporting list.
- Name the reader and the decision. Who looks at it, and what do they do next? "Dana decides which region to call."
- Pick the form. If the decision is "is something wrong?", build a dashboard. If it is "what exactly happened?", build a report. If both, build a dashboard that links to the report.
- Check the refresh. Match the data refresh to the decision's pace. Hourly decisions need hourly data. Weekly decisions do not.
- Decide how it travels. Does the reader log in, or does it need to arrive as email, PDF, Excel or a file drop? Anything that must arrive is a delivery job.
- Count the variations. One version for everyone is a simple subscription. One version per region, customer or department is bursting, and it is where automation earns its place.
- Plan for failure. Decide who finds out if a send fails, and what retries. Unattended delivery needs monitoring.
- Test with one real recipient before widening the list, and confirm that permissions and filters show only what each person should see.
Step 3 trips up many teams. A dashboard whose data refreshes at 2 a.m. and a delivery scheduled for 1 a.m. sends yesterday's numbers. Triggering the send after the refresh finishes avoids that, and our post on making alerts reliable with nightly refreshes explains the pattern. For alerts versus emailed reports, Can Power BI send email alerts? lays out the options.
Delivering dashboards, not just reports
A common surprise: teams want a dashboard in someone's inbox. A dashboard is meant to be interactive, but executives often want it on their phone before the meeting. Sending a snapshot or export of the dashboard turns it into a report for that reader, which is fine as long as you design it to export well: fewer tiles, readable labels, and a link back to the live view. Our post on sharing Power BI dashboards via email covers the practical options, and PBRS delivers Power BI reports and dashboards shows how that works with PBRS.
Put delivery on a schedule
If your reporting list has dozens of recipients, several formats and more than one BI tool, PBRS, ATRS and CRD take the scheduling, personalizing, exporting and secure delivery off your team's plate. IntelliFront BI covers the self-hosted dashboard side. You can see the full lineup on the ChristianSteven Software site.
Start with the one report your team exports by hand every week. That is usually the clearest case for automating.
Our perspective
The dashboard versus report debate usually ends at design. We think it should end at delivery. A dashboard that nobody opens and a report that nobody receives fail in the same way: the right person did not get the right information at the right time.
Native scheduling is a good starting point, and for small audiences it is often enough. The trouble comes when reporting demand grows. More recipients, more formats, more filters, more destinations. At that point, teams stitch together flows and scripts that only one person understands.
Our approach is to automate the full path. PBRS, ATRS and CRD schedule, personalize, export, package and deliver content from Power BI, SSRS, Tableau and Crystal Reports, with data-driven bursting and event triggers, so the people who build the reports stop being the people who send them. IntelliFront BI gives organizations a self-hosted home for dashboards, KPIs and reports.
Keep dashboards for monitoring and reports for detail, then let software handle the logistics.
Christian Ofori-Boateng
FAQ
Is a dashboard considered a report?
Sometimes, depending on the tool and the use. In Power BI, they are different objects: a report is built on a dataset, and a dashboard is a single page of pinned tiles. Once a dashboard is exported or emailed as a PDF or snapshot, it behaves like a report for the reader.
Can I email a dashboard on a schedule?
Yes. Power BI email subscriptions deliver dashboard snapshots on hourly, daily, weekly, monthly or after-refresh schedules, and recipients do not need a Power BI license. If you need per-recipient filtering, attachments or other destinations, report automation software handles that. See our guide to Power BI automation subscriptions for enterprise reporting.
Should I use real-time dashboards or scheduled reports?
Match the tool to the pace of the decision. Use a live dashboard when the value of the information fades within minutes or hours. Use a scheduled report for calendar-driven decisions, fixed records and audiences who do not log into the BI tool. Many teams use both for the same data.
Why does my dashboard alert not fire more often?
Alerts evaluate only when the dataset refreshes. If your data refreshes nightly, the alert can trigger at most once a day regardless of its frequency setting. Increasing the refresh rate, or triggering sends on refresh completion, changes that.
Which should I build first, the dashboard or the report?
Start from the decision. If readers first need to know whether something is wrong, build the dashboard and link it to the report. If they already know what they are looking for and need the detail, build the report first.