
Pick your top business-priority KPIs first, then decide static or anomaly logic for each one before you touch a configuration screen. From there: choose an operator and value, set a short evaluation window with a duration or debounce rule so single spikes don't fire alerts, and route notifications by severity instead of blasting every channel at once.
Copy this into a ticket or runbook before you build anything:
- Metric + aggregation chosen (avg, sum, max, min, or percentile)
- Operator, threshold value, evaluation window, and duration set
- Notification cadence and escalation path assigned per severity tier
Key Takeaways
Reliable KPI threshold alerts depend on choosing business-relevant thresholds, adding duration or hysteresis to prevent flapping, and pairing alert logic with dependable data delivery.
| Point | Details |
|---|---|
| Start with business impact | Set threshold values tied to numbers that actually trigger a business decision, not round figures. |
| Add duration before firing | Use a hold period or debounce rule so single spikes don't trigger false alerts. |
| Match alert type to metric behavior | Use static thresholds for stable metrics, anomaly detection for seasonal or high-variance ones. |
| Group and no-data alerts catch different failures | Group alerts split by entity; no-data alerts catch silent telemetry gaps that value-based rules miss. |
| Reliable delivery underpins reliable alerts | ChristianSteven Software automates report scheduling and delivery with retry handling, so alert data stays current. |
Table of Contents
- What Is a KPI Threshold Alert?
- What Types of Threshold Alerts Exist?
- How Do You Configure a Threshold Alert Step by Step?
- How Do You Choose the Right Threshold Value?
- How Does Evaluation Frequency Affect Alert Reliability?
- How Should You Set Up Notifications and Escalation?
- How Do You Test and Tune KPI Alerts Before Launch?
- What Should You Confirm Before Going Live?
- The Real Problem Isn't Thresholds, It's Delivery
- Make Your KPI Alerts Reliable, Not Just Configured
- Sources
- FAQ
What Is a KPI Threshold Alert?
A KPI threshold alert fires when a metric crosses a defined value using a specific comparison operator, evaluated over a chosen aggregation and time window. If average CPU exceeds a high utilization level for a sustained period, that's a threshold alert doing its job.
A few terms show up in nearly every alerting interface, whether you're working in Power BI, Tableau, or an observability platform:
- Metric: the raw value being tracked (revenue, latency, error count)
- Threshold: the number the metric is compared against
- Operator: the comparison logic (
>,>=,<,<=) - Aggregation: how raw data points combine into one value (avg, sum, max, min, percentile)
- Evaluation window: the time span the aggregation covers
- Duration: how long the condition must persist before the alert fires
- Group-by: splits one alert rule into many, one per entity (host, customer, product)
- No-data: a separate trigger for when a metric stops reporting entirely
What Types of Threshold Alerts Exist?
Static thresholds compare a metric to a fixed number, the most common setup and the easiest to reason about. Percentile and aggregation-driven alerts instead watch a distribution (like p95 latency) rather than a single point value, which catches outliers that averages hide. Group or per-entity alerts apply one rule across many objects, generating a separate alert instance for each host, customer, or product that breaches the condition. No-data alerts are their own category, firing not because a value crossed a line but because the value stopped arriving at all.
Many platforms also support multi-tier severity sets. Rockwell Automation's KPI Alerts documentation describes a Low/Medium/High structure where High severity is evaluated first; if that threshold breaches, the system skips checking Medium and Low for that cycle.
- Static: fixed number, simple, fast to configure
- Percentile/aggregation-driven: better for skewed or spiky data
- Group/per-entity: one rule, many independent alerts
- No-data: catches silent failures, not just bad values
Pro Tip: Use severity tiers on one metric when the business impact scales with how far you've crossed the line (revenue dip vs. revenue collapse). Use separate alert rules when the underlying condition is genuinely different, like "sales dropped" versus "sales data stopped arriving."
How Do You Configure a Threshold Alert Step by Step?
Most BI and observability tools follow the same underlying sequence, even if the screens look different.
- Pick the KPI visual or raw metric. A visual-based alert can keep evaluating even after the chart is edited or deleted, as long as the underlying dataset stays valid, according to AWS's QuickSight documentation.
- Choose the aggregation. Decide whether you want average, sum, max, min, or a percentile, per Datadog's threshold monitor docs.
- Choose the operator. Greater than, less than, or their inclusive variants.
- Enter the threshold value. Ground this in a real business number, not a round guess.
- Set the evaluation window and duration. A window of five minutes with a two-minute duration behaves very differently than an instant check.
- Choose grouping. Decide if this alert should split by host, region, product line, or customer.
- Set notification channels and frequency. Email, Slack, or a paging tool, and how often you want to hear about it.
Two quick examples: "average daily sales below a specified target" or "CPU average above a high utilization level for a sustained period." One common pitfall worth flagging early: alert rules tied to a specific visual sometimes survive dashboard redesigns silently, which means nobody remembers they exist until they misfire months later. Building alerts against the underlying dataset or metric definition, rather than a visual, avoids that surprise.
Related reading on how Power BI data-driven alerts improve business processes covers configuration patterns specific to that platform.
How Do You Choose the Right Threshold Value?
Start with a number tied to real business impact, not a statistically convenient one. For metrics with strong seasonality (weekend traffic, month-end billing spikes), a flat static threshold usually generates noise on the exact days it shouldn't; that's when anomaly-based or time-series-aware alerting earns its complexity, since it compares current behavior against expected patterns rather than one fixed line.
- Business-impact numbers beat convenient round numbers
- Percent change works better than absolute values for volatile metrics
- Add seasonal guardrails before enabling static thresholds on cyclical data
- High-variance metrics (CPU, error rates) usually need anomaly detection over static rules
Numeric examples include cases such as flagging conversion rate drops below a low percentage threshold, CPU usage sustained at a high level for several minutes, or notable decreases in average order value over short periods.
Pro Tip: Add a short hold duration, sometimes called hysteresis, before an alert fires. Prometheus's alerting rules use a "for" clause specifically to prevent momentary spikes from triggering noisy, short-lived alerts.
Evaluation frequency has a real cost implication too. QuickSight bills threshold alerts per evaluation, which means checking a metric every minute instead of every hour isn't just a sensitivity choice, it's a line item.
How Does Evaluation Frequency Affect Alert Reliability?
Evaluation cadence usually falls into two patterns: near-real-time checks that run on a fixed interval regardless of data freshness, or dataset-refresh-driven checks that only re-evaluate when new data lands. GoodData's platform, for example, checks KPI values at each data load rather than on a separate clock, which means alert timeliness is only as good as your refresh schedule.
- Group alerts generate one instance per entity (per host, per customer, per SKU) rather than a single rule for everything
- Elastic Observability's custom threshold rules support grouping by field and an optional "no data" trigger for missing telemetry
- No-data alerts matter most for metrics where silence is itself the failure, like a customer that stops sending events entirely
How Should You Set Up Notifications and Escalation?
Notification cadence options generally split into four patterns: as-frequent-as-possible (every evaluation), periodic summaries, only-on-change, and only-when-resolved. Elastic's action frequency settings let you choose between firing on every check interval or only when status actually changes, which matters a lot for reducing duplicate noise.
A sensible escalation pattern looks like: warning tier to a Slack channel, alert tier to email plus Slack, and critical tier to a paging tool like PagerDuty. Sysdig's threshold alerts support warning and alert thresholds together, along with notification snapshots that add context automatically.
- As-frequent-as-possible: highest visibility, highest noise risk
- Summary intervals: good for lower-priority metrics
- Only-on-change: cuts repeat noise for persistent issues
- Only-when-resolved: useful for confirming recovery, not detection
Pro Tip: Every notification should include the metric name, current value, threshold, time window, and any filters applied, plus a direct link to the dashboard. ThoughtSpot's Monitor documentation notes that alerts respect underlying filters even when the notification email itself doesn't list them, so state the filter context explicitly to avoid confused triage.
How Do You Test and Tune KPI Alerts Before Launch?
Testing an alert rule before it reaches production saves you from the worst kind of incident: the one where nobody got paged.
- Run a dry-run test by injecting sample data or using a platform's built-in test-notification feature.
- Watch the pending state behavior; most systems (Prometheus included, per its own docs) hold an alert in "pending" before it fires, which is your chance to confirm timing is right.
- Track operational metrics after launch: alert frequency, mean time to acknowledge, and false-positive rate.
- Retune by increasing duration, switching aggregation type, adding a group filter, or moving to anomaly detection if static thresholds keep misfiring.
Pro Tip: Put a recurring calendar reminder on every alert rule, quarterly at minimum, to review whether the threshold still matches current business volume. Metrics that doubled in scale since launch usually have thresholds that are now meaningless.
For deeper guidance on this cycle, see this report monitoring and alerting guide.
What Should You Confirm Before Going Live?
Run through this before flipping any alert to active:
- Metric, aggregation, and filters are correct and tested
- Evaluation schedule and its cost or refresh implications are understood
- Notification recipients and escalation path are assigned by severity
- Test notifications fired successfully and alert history is logging
- A review cadence and an owner are named
The Real Problem Isn't Thresholds, It's Delivery
Most broken KPI alert setups I've reviewed weren't broken because someone picked a bad threshold value. They failed because the underlying report stopped refreshing, a filter silently changed, or a notification bounced and nobody noticed for three weeks. Threshold logic gets all the attention in documentation because it's the interesting technical problem. Delivery reliability gets none of it, and it's the more common failure mode.

Good alert design assumes the data pipeline behind it is solid: scheduled refreshes that actually run, retries when a delivery fails, and filters that persist exactly as configured. Automation that handles scheduling and delivery retries doesn't replace good threshold logic, it's what makes threshold logic worth trusting in the first place.
Make Your KPI Alerts Reliable, Not Just Configured
A well-tuned threshold rule is only as good as the report and data pipeline feeding it. If your KPI dashboard alert fires but the underlying report failed to refresh overnight, you've built a false sense of security, not a monitoring system. ChristianSteven Software automates the scheduling, formatting, and delivery layer that sits underneath your BI reporting, with built-in retry handling for failed deliveries and SOC 2 Type II certified reliability behind it, so the data feeding your alerts is actually current when the threshold check runs.
If you're running Power BI, automated report exports with PBRS can handle the delivery side while your alert rules handle detection. Tableau teams can look at automated report scheduling with ATRS for the same reliability layer. Start a free trial and see whether your current alert failures are actually threshold problems or delivery problems.
Sources
- Metric monitors — Threshold (Datadog)
- Create threshold-based alerts in Amazon QuickSight (AWS Big Data Blog)
- Alerting rules (Prometheus)
- Custom threshold alert (Elastic Observability)
- Threshold Alerts (Sysdig)
FAQ
What Does a KPI Threshold Mean?
A KPI threshold is the fixed value or condition a metric must cross, using an operator like greater than or less than, before an alert fires.
What Is a Threshold Alert?
A threshold alert is a notification triggered automatically when a monitored metric crosses a defined value over a specific evaluation window, as described in Datadog's monitor documentation.
What Are the Three Types of Alerts?
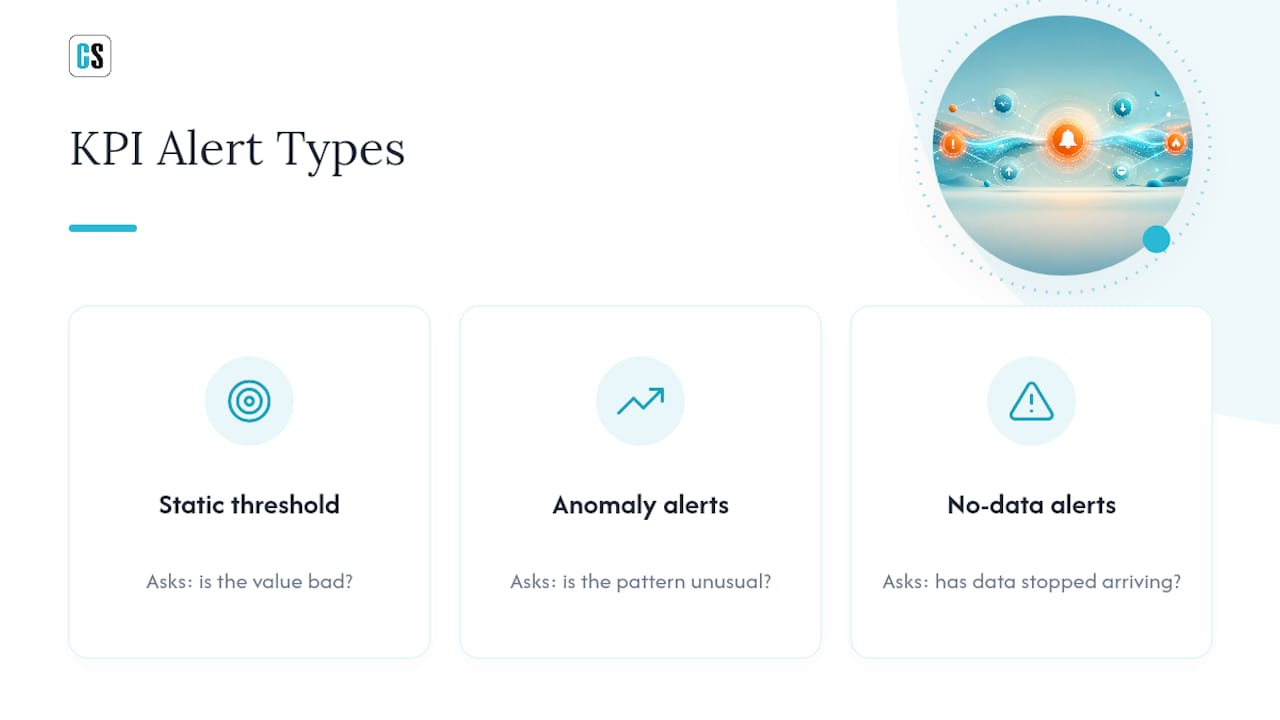
Common categories include static threshold alerts, anomaly or percentile-based alerts, and no-data alerts, each answering a different question: is the value bad, is the pattern unusual, or has data stopped arriving at all.
What Are the 5 Key Performance Indicators?
The specific five KPIs a business tracks vary by industry and goals, so there's no single universal list; most teams start by choosing three to five metrics tied directly to revenue, customer retention, or operational efficiency, as covered in this guide to tracking business goals with KPIs.
How Many KPI Alerts Should a Team Run at Once?
There's no fixed number, but starting with a small set of business-priority metrics and expanding gradually helps avoid alert fatigue before your team has tuned the thresholds properly.