
Report automation typically runs $5,000 to $15,000 for a focused, production-grade implementation, and can push past $50,000 for full enterprise data foundations with multi-entity consolidation. Most finance and IT teams see payback inside six to fourteen months once manual reporting hours and error costs get factored in. Before committing budget, run a short diagnostic or a one to two week pilot on a single report or dashboard to explore practical AI tools for small businesses that can improve ROI. It's the cheapest way to pressure-test your assumptions before signing anything larger.
TL;DR:
- Most report automation projects cost between $5,000 and $15,000 for focused implementations, with enterprise setups exceeding $50,000 depending on complexity.
- The major cost drivers include software licenses (a few hundred to over a thousand dollars monthly), implementation hours (several hundred over one to two months), and ongoing maintenance for data schema changes and system updates.
- Data complexity significantly impacts costs, with multiple sources, undocumented endpoints, and manual work increasing hours and budget requirements proportionally.
- A typical project timeline involves one to two weeks for discovery, two to four weeks for a pilot, four to eight weeks for expansion, and ongoing maintenance after launch.
- Budget accuracy improves by breaking costs into categories—software, implementation, and maintenance—and starting with a detailed diagnostic before larger investments.
Table of Contents
- What Drives the Final Report Automation Cost
- How Much Does Report Automation Cost by Approach?
- What Are the Actual Cost Components of a Report Automation Project?
- Why Do Report Automation Costs Balloon After Launch?
- How Do You Calculate TCO and ROI for Report Automation?
- What's the Realistic Timeline From Diagnostic to Production?
- Are You Actually Ready to Automate Reporting?
- The Author's Take on Report Automation Costs
- What I Think Most Budget Conversations Get Wrong
- How ChristianSteven Software Fits Your Report Automation Budget
- Sources
- FAQ
What Drives the Final Report Automation Cost
Every report automation quote breaks down into three buckets: the tooling itself, the labor to implement it, and the ongoing work to keep it running. Skip any one of them in your budget and you'll blow past your estimate within the first quarter.
Tooling and subscriptions cover the software license or SaaS fee. For a mid-tier production stack, that alone runs from a few hundred to over a thousand dollars a month depending on connector count and data volume, according to Automation Labz. That's before you touch a single hour of setup work.
Implementation labor is where most budgets go sideways. A Tier 2 build, meaning a warehouse, several connectors, transformation logic, and dashboards, typically takes several hundred hours spread across a month or two. Consultant rates can vary widely, so labor costs can be significant, separate from the software.
Ongoing operations often get underestimated. Once live, the system requires regular monitoring and maintenance, often several hours a week, including fixing broken connectors, adjusting for schema changes, and addressing finance team's questions.
Data complexity is the multiplier that changes everything. A single clean data source with a documented API is a different project than five legacy systems with undocumented endpoints and inconsistent naming conventions. Every extra source, every quirky API, every manual workaround in your current process adds hours, not dollars, and hours are where costs actually escalate.
Here's how to think about the one-time versus recurring split:
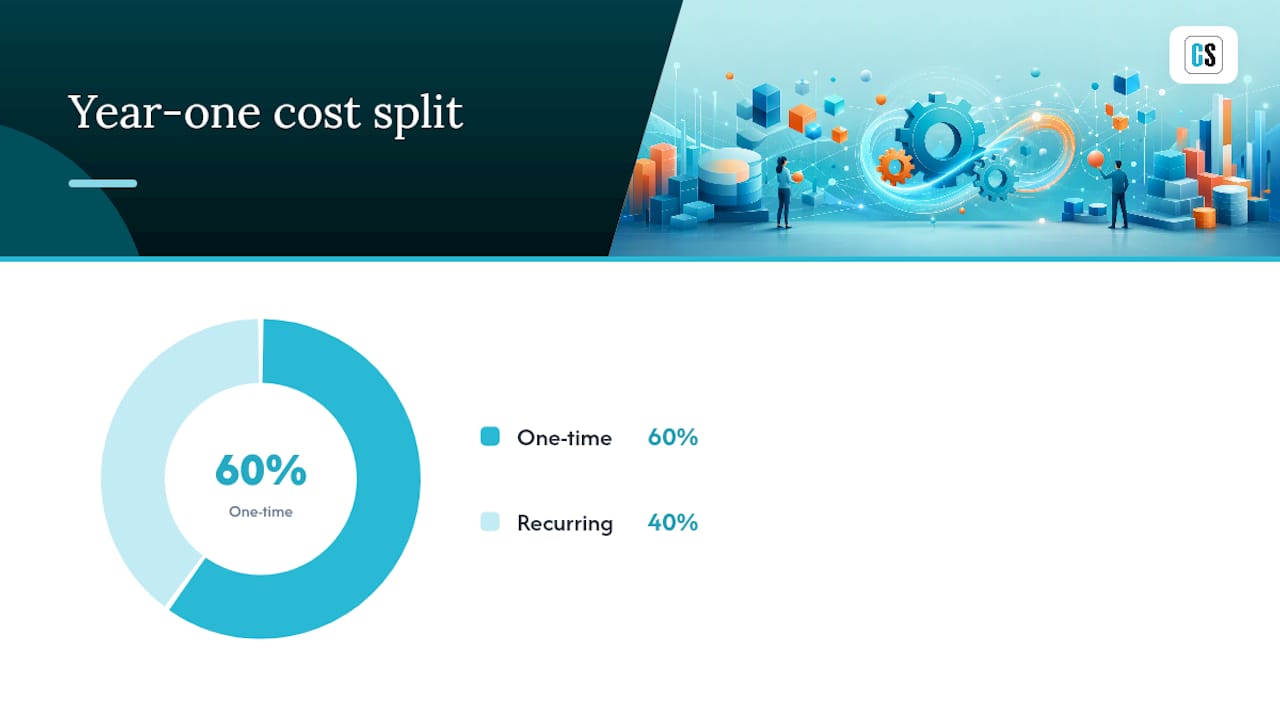
- One-time costs: discovery and requirements gathering, initial data mapping, connector builds, dashboard design, testing and validation.
- Recurring costs: software subscription or license renewal, maintenance hours, API monitoring, support contracts, periodic re-testing after source system changes.
- Often missed: documentation and training time, which pays for itself the first time someone other than the original builder has to fix something.
- Rule of thumb: budget your one-time cost as roughly 60% of your total year-one spend, with the remaining 40% covering subscription fees and maintenance.
A tool like ChristianSteven Software can shift some of this recurring maintenance burden by handling scheduling, formatting, and delivery natively rather than through custom scripts, which changes where your labor dollars go rather than eliminating them entirely.
How Much Does Report Automation Cost by Approach?
The buying lane you pick determines your realistic price range before you even get a quote. Deciding upfront whether you're doing this yourself, hiring a freelancer, engaging a consultant, or building a full enterprise foundation narrows your options fast and keeps procurement conversations grounded.
-
DIY SaaS and templates. This is the lowest-cost entry point on paper, often tens to low hundreds of dollars a month for a subscription tool with prebuilt connectors. The catch is hidden maintenance. Someone on your team ends up babysitting broken integrations and rebuilding templates every time a source system changes its schema. G2 reviews of platforms like Domo consistently flag connector reliability and ongoing upkeep as the top complaints, which tells you the sticker price rarely reflects the real cost. This lane fits small teams with one or two data sources and simple, stable reporting needs.
-
Freelancer or small agency. For a single-source dashboard with straightforward logic, expect a one-time cost in the low thousands, based on consultant pricing benchmarks from Alexander Nemeth's data automation pricing breakdown. Time to value is usually two to four weeks. This works well for a company that needs one reliable report done right without a long engagement, but you'll want a clear handoff plan since freelancers rarely stick around for year two.
-
Consultant or mid-market engagement. This is the lane most finance departments land in. A diagnostic alone runs $500 to $2,000. Budget-versus-actual automation, month-end close reporting, or similar scoped finance projects typically cost $5,000 to $15,000, per the same consultant pricing data. Timeline runs four to eight weeks from kickoff to production. This tier matches companies with multiple data sources, real complexity in their reporting logic, and a need for something that survives staff turnover.
-
Full enterprise data foundation. When you're consolidating multiple business entities, standardizing metrics across departments, or building a warehouse from scratch, costs climb to $15,000 to $50,000 or higher, according to Nemeth's pricing tiers for full finance overhauls. MLDeep's 2026 pricing guide frames the $5,000 to $15,000 band as the entry point for genuinely production-grade systems, with enterprise builds extending well beyond that depending on entity count and regulatory reporting requirements. Timelines stretch to three to six months, and this lane demands executive sponsorship because it touches how the whole organization defines its numbers.
The lane you choose also dictates who signs off. DIY tools might not need procurement at all. Consultant engagements usually need a department head. Enterprise foundations need IT, finance, and often legal in the room before contracts get signed.
What Are the Actual Cost Components of a Report Automation Project?
Break a project quote into its parts and you can sanity-check any vendor's number against your own math, rather than taking their total on faith.
Software licensing comes in three common models: per-seat pricing (you pay per user who accesses reports), per-connector pricing (you pay based on how many data sources you link), and capacity-based pricing (you pay based on data volume or report frequency). A ten-person finance team pulling from three systems might pay $500 to $2,000 a month depending on which model a vendor uses, so always ask which model applies before comparing quotes side by side.
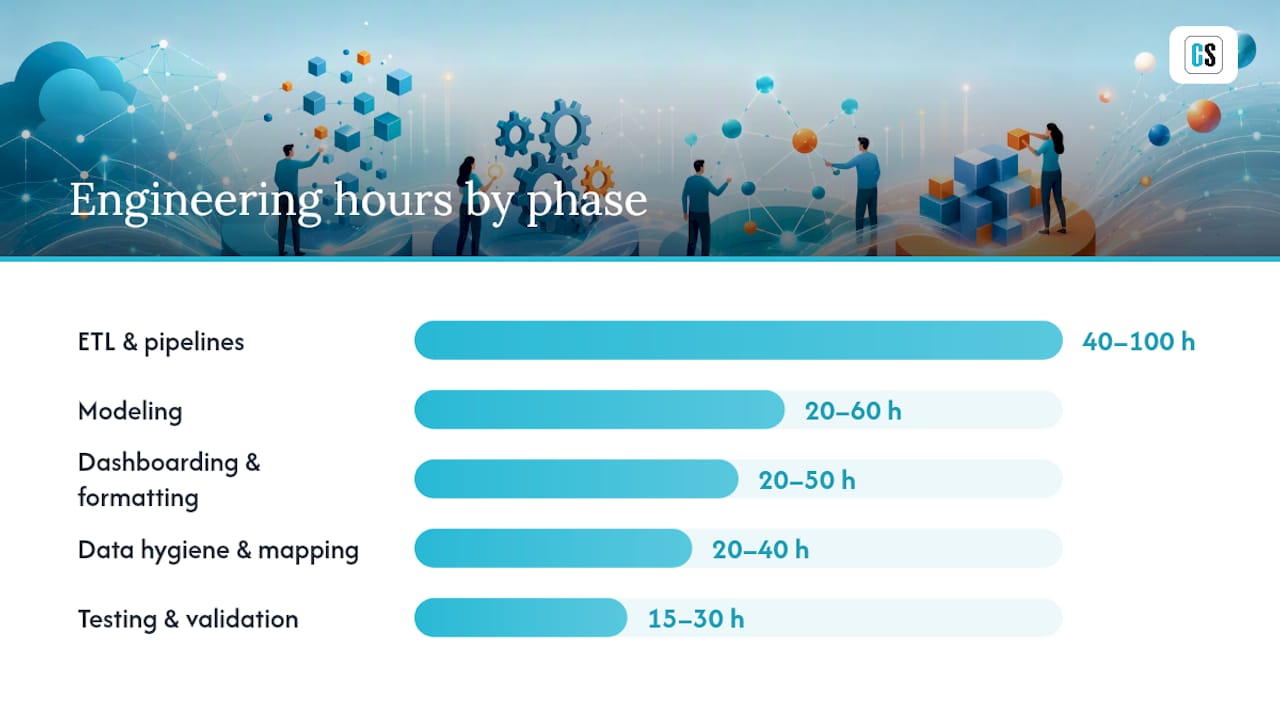
Engineering and consulting hours break down by phase:
- Discovery (defining requirements, mapping current manual process): 10 to 20 hours.
- ETL and data pipeline work (extracting, transforming, loading data): 40 to 100 hours depending on source count.
- Modeling (building the logic that turns raw data into report-ready metrics): 20 to 60 hours.
- Dashboarding and formatting (visual layer, scheduling, delivery rules): 20 to 50 hours.
- Testing and validation (checking output against manual reports): 15 to 30 hours.
Data hygiene and mapping is the line item everyone forgets to quote. If your source systems use inconsistent naming, missing fields, or duplicate records, add 20 to 40 hours just to clean and document the mapping before any automation logic gets built. Documentation itself, meaning a written record of what each field means and where it comes from, takes another 10 to 15 hours but saves far more than that in future troubleshooting.
Infrastructure costs cover the warehouse or compute layer if you're not already on one, plus observability tools that alert you when a data pipeline breaks. Budget $100 to $500 a month for a small to mid-size warehouse, more if you're processing high volumes daily.
Pro Tip: Ask any vendor or consultant to break their quote into these five categories separately. A single lump-sum number hides where your money actually goes, and it makes it nearly impossible to negotiate or to compare two bids against each other.
Why Do Report Automation Costs Balloon After Launch?
The initial build is rarely what breaks a budget. It's what happens six months later when a source system updates its API and nobody notices until the Monday report shows zeroed-out revenue.
API and schema changes are the single biggest source of unplanned cost. Source systems update without warning, field names change, authentication methods get deprecated, and your automation quietly breaks or, worse, keeps running and feeds bad numbers into an executive dashboard. Monitoring and alerting for these changes needs to be a budgeted line item, not an afterthought.
A documented metric dictionary prevents a huge share of this pain. When "revenue" means one thing in your CRM and something slightly different in your accounting system, every automated report built on top of that ambiguity is a future dispute waiting to happen. MIT Sloan Management Review's analytics coverage treats this kind of governance as foundational to trustworthy analytics, not optional polish.
Budget for these recurring realities:
- Support SLAs: define response time for a broken report before you need it, not after.
- Change windows: schedule when source system updates happen so your team can test automation against them proactively.
- On-call engineering hours: someone needs to own "the report is wrong" tickets, and that person's time costs money whether or not it's in your original budget.
- Version control for report logic: track what changed and when, so a bug six months from now doesn't take a week to trace.
It's recommended to budget a contingency of roughly 10 to 20% of your total project cost for year one, specifically for maintenance surprises and adapting to API changes, according to Automation Labz's implementation data. Teams that skip this line almost always end up requesting emergency budget mid-year, which is a far worse conversation to have with finance leadership than planning for it upfront.
The failure mode to watch for: a connector silently fails, the report keeps running on stale cached data, and nobody catches it until a stakeholder asks why last quarter's numbers never updated. That's not a hypothetical. It's the most common support ticket in automated reporting environments, and it's entirely preventable with basic monitoring built into the original scope.
How Do You Calculate TCO and ROI for Report Automation?
Total cost of ownership is your one-time build cost plus three years of recurring costs: subscription fees, maintenance hours, and contingency. Leave out any of those three and your TCO number will look artificially attractive, which is exactly how budgets get approved on numbers that don't survive contact with year two.
The formula: TCO = (one-time implementation cost) + (annual subscription × 3) + (annual maintenance hours × hourly rate × 3) + (contingency reserve).
Payback period compares that TCO against what you're saving: hours of manual reporting work eliminated, plus the cost of errors you're no longer making. Arahi AI's finance automation research frames payback as often achievable in under a few months when the hours-saved math is conservative and assumptions hold.
Here's how the math plays out across two realistic scenarios:
For the small company, the upfront cost divided by monthly value saved results in breakeven within half a year to several months, with subscriptions and maintenance extending the realistic payback period somewhat.
For the mid-market scenario, the build cost against monthly savings suggests payback within about a year. Adding subscription and maintenance costs extends the payback period but typically stays within acceptable business thresholds.
Run both an optimistic and a conservative version of these numbers before you present them internally.
- Optimistic case: assumes maintenance stays at the low end and hours saved hold steady or grow.
- Conservative case: assumes maintenance runs at the high end of estimates and hours saved starts lower in month one while your team adjusts to the new process.
- What to test: cut your "hours saved" assumption by 25% and see if payback still falls under twelve months. If it doesn't, your business case is too fragile to present as-is.
What's the Realistic Timeline From Diagnostic to Production?
Most report automation projects follow four phases, and skipping straight to phase three without doing phase one properly is how projects go over budget.
- Discovery and diagnostic (one to two weeks). Map your current manual process, identify data sources, and document what "done" looks like. Deliverable: a scoped project brief with cost estimate. Exit criteria: stakeholders agree on which report or dashboard the pilot will cover.
- Pilot sprint (two to four weeks). Build automation for a single report or dashboard, end to end. Deliverable: a working automated report that matches your manual version, validated line by line. Exit criteria: the pilot output passes a side-by-side accuracy check against the manual process it replaces.
- Expand (four to eight weeks, depending on scope). Roll the pilot's architecture out to additional reports or data sources. Deliverable: a production system covering your priority reporting needs. Exit criteria: monitoring and alerting are live, and a documented runbook exists for common failures.
- Steady-state operate (ongoing). Maintenance, monitoring, and periodic re-validation as source systems change. Deliverable: monthly or quarterly health checks. Exit criteria: none. This phase runs indefinitely and should be in your recurring budget from day one.
On the procurement side, build in time for a security review if you're connecting to sensitive financial or customer data, contract negotiation for SLA terms, and a trial or demo period, usually free or low-cost, to validate fit before signing a longer contract.
Pro Tip: Don't let phase two drag past four weeks. If your pilot sprint is taking longer than that, the scope crept, and you need to cut it back to a single report before it eats your whole budget on one deliverable.
Sign-off typically follows the money: a department head can approve a freelancer engagement, but anything touching multiple systems or crossing $15,000 usually needs finance and IT both at the table.
Are You Actually Ready to Automate Reporting?
Not every team should automate right now, and pushing ahead anyway is how projects turn into expensive rework. A few signs you're ready, and a few that say wait.
You need a documented metric dictionary before you automate anything. If three people on your team would define "active customer" three different ways, automating the report just locks in the confusion at scale and makes it harder to fix later. Canonical joins, meaning agreed-upon rules for how tables connect across your data sources, need to exist before a machine tries to guess them.
Volume and complexity thresholds matter too. If you're manually pulling together fewer than five reports a month from a single, stable data source, automation might cost more than it saves in year one. The math tends to favor automation once you're combining three or more sources, running reports weekly or more often, or spending more than eight hours a month on manual compilation and formatting.
Signs you should delay:
- Your source systems are actively changing (a CRM migration, an ERP switch) within the next six months.
- Nobody on your team can explain how a key metric is currently calculated without checking with someone else first.
- You've had major staffing turnover in the team that owns reporting, and institutional knowledge hasn't been documented yet.
- Your current manual process has known errors nobody's tracked down the root cause for.
Fixing these first costs less than automating a broken process and discovering the automation just replicates the same mistakes faster. A manual versus automated reporting comparison can help clarify whether your current pain points are process problems or genuine automation opportunities.
The Author's Take on Report Automation Costs
Christian Ofori-Boateng draws on more than two decades of experience helping organizations automate business intelligence reporting across Power BI, Tableau, SSRS, and Crystal Reports environments. That experience shapes how ChristianSteven Software approaches cost conversations: start narrow, prove value, then expand.
The cost buckets outlined above map directly onto product decisions. If your pain point is getting Power BI reports formatted and delivered to the right people without wrestling with Power Automate, PBRS handles scheduling, export formatting, and delivery. Tableau users facing the same delivery gap look at ATRS, while teams still running Crystal Reports rely on CRD for the same scheduling and distribution logic. For teams that need centralized, real-time dashboards and KPIs rather than static report delivery, IntelliFront BI covers that layer, including event-triggered refreshes and error handling that would otherwise require custom scripting.
That last point matters for the "hidden costs" section above. Event triggers and automated error handling are exactly the kind of maintenance line items that balloon a DIY or freelancer-built system. When a platform handles them natively, that's labor your team isn't paying a consultant to rebuild every time a schema changes.
It is often recommended to start with a diagnostic or a single-dashboard pilot, the same scoped approach described in the timeline section, rather than committing to a full rollout before proving the model against your own data. Holding a SOC 2 Type II certification can be important to the security review procurement step described above.
What I Think Most Budget Conversations Get Wrong
The conventional advice treats report automation cost as a single number to negotiate down. That's backwards. The real budget question is which lane you're buying in, DIY, freelancer, consultant, or enterprise foundation, and most overruns happen because a team picks the cheap lane for a problem that actually needs the consultant lane's rigor.
What's overrated: chasing the lowest subscription price. A $20-a-month tool with unreliable connectors costs more in staff hours over a year than a $700-a-month platform that just works. What's underrated: the metric dictionary. It's the cheapest line item in any project and the one most likely to get cut, right before it causes the most expensive argument six months later about whose numbers are correct.
Prioritize the diagnostic phase over the build phase. Every inflated quote I'd expect a reader to encounter traces back to a scope that was never properly diagnosed. Spend the $500 to $2,000 on a real diagnostic before you spend $15,000 on a build you can't fully justify yet.
*— Christian Ofori-Boateng *
How ChristianSteven Software Fits Your Report Automation Budget
Certain enterprise report automation solutions can help reduce ongoing maintenance costs by handling scheduling, formatting, delivery, and error handling as built-in features rather than requiring custom scripts or manual retriggers.
Choose a product that aligns with your reporting software stack and needs, such as solutions designed for Power BI, Tableau, Crystal Reports, or centralized dashboards and KPIs with real-time refresh triggers. When scoping a pilot, consider features like event-triggered delivery, multi-format export options, and error handling logging, since these features impact ongoing maintenance efforts.
Start with a scoped conversation rather than a full commitment. You can set up KPI dashboards free for 30 days to test how the platform handles your actual data before any budget gets locked in, or go straight to the product built for your stack: automate Power BI report exports with PBRS or automate and share Tableau reports with ATRS.
Sources
The price ranges and payback figures throughout this article come from a handful of sources worth reading in full if you're finalizing a budget. MLDeep's 2026 pricing guide gives approach-based price bands useful for sanity-checking a vendor quote. Alexander Nemeth's consultant pricing breakdown is the most granular source for finance-specific project costs, from diagnostics through full overhauls. Automation Labz's implementation data offers concrete hours and maintenance benchmarks for a Tier 2 production stack. For ROI math specifically, Arahi AI's finance automation research provides payback framing worth adapting to your own hours-saved numbers. When applying any of these, adjust for your actual data source count and team hourly rate before treating a published range as your own budget.
- How Much Does It Cost to Automate Reporting? (2026 Pricing) | MLDeep Blog
- What Finance Reporting Automation Actually Costs (Real Numbers, No Gatekeeping) | Alexander Nemeth - Data Systems Consultant
- Reporting dashboards automation · Automation Labz
- ROI of Report Generation Automation in Finance | Arahi AI
FAQ
What Is Report Automation?
Report automation is the practice of using software to schedule, generate, format, and deliver business reports and dashboards without manual intervention, pulling from sources like Power BI, Tableau, SSRS, or Crystal Reports and distributing them to the right recipients on a set schedule or trigger.
How Much Does Report Automation Typically Cost?
A production-grade implementation usually costs $5,000 to $15,000 for a focused project, while full enterprise data foundations with multi-entity consolidation can run $15,000 to $50,000 or more.
How Much Does Data Analytics Software Cost?
Data analytics software pricing varies widely, starting from a few hundred dollars a month for entry-level SaaS tools up to over a thousand dollars a month for mid-market platforms with more connectors and higher data volume, depending on the licensing structure.
What Are the Top Reporting Tools for Automated Delivery?
For organizations already running Power BI, Tableau, SSRS, or Crystal Reports, purpose-built delivery and scheduling tools like PBRS, ATRS, CRD, and IntelliFront BI from ChristianSteven Software extend those platforms with automated formatting, distribution, and error handling rather than replacing the reporting tool itself.
How Long Does It Take to See Payback on Report Automation?
Payback commonly falls between six and fourteen months, with some finance-focused automation projects reaching breakeven in under a few months when manual hours saved and reduced error costs are calculated conservatively, according to Arahi AI's ROI research.