
A report delivery failure is any breakdown that stops a scheduled or triggered Power BI, SSRS, Tableau, or Crystal Reports job from generating, rendering, or reaching its destination. It has nothing to do with email bounces. When one happens, check run history and delivery confirmation first, then work down through credentials, gateway, and source connections. Most failures trace back to one of those three layers.
TL;DR:
- Failures can result from scheduling issues, rendering errors, or delivery blockages, each requiring different troubleshooting approaches.
- Checking the run-history log and the existence of output files within the first 10 minutes is crucial for accurate diagnosis.
- Layer-by-layer analysis, starting from the scheduler and moving down to data sources, speeds up root cause identification and fixes.
- Automated alerts should focus on meaningful failure details, with tiered responses based on business impact to prevent alert fatigue.
- Conducting controlled burst tests with at least 100 recipients helps validate architecture readiness for real delivery volume and timing constraints.
Table of Contents
- What Counts as a Report Delivery Failure in BI Automation?
- Immediate Triage Checklist for a Failed Report
- How Do You Diagnose the Root Cause Layer by Layer?
- What Metrics and Alerts Catch Failures Before Users Notice?
- When Should You Auto-Retry vs. Escalate for Manual Review?
- How Do You Test Delivery Reliability Before a Full Rollout?
- Which Operational Controls Prevent Repeat Failures?
- Why These Controls Work: Publisher and Product Fit
- The Real Shift Teams Need to Make
- Get Enterprise-Grade Delivery You Can Actually Trust
- Sources
- FAQ
What Counts as a Report Delivery Failure in BI Automation?
A failed delivery falls into one of three buckets: the job never ran (scheduler issue), the job ran but failed to render (engine or data source issue), or the job rendered but never reached recipients (gateway or connector issue). Distinguishing between these three matters because each points to a different fix, and confusing them wastes the first, most valuable hour of an incident.
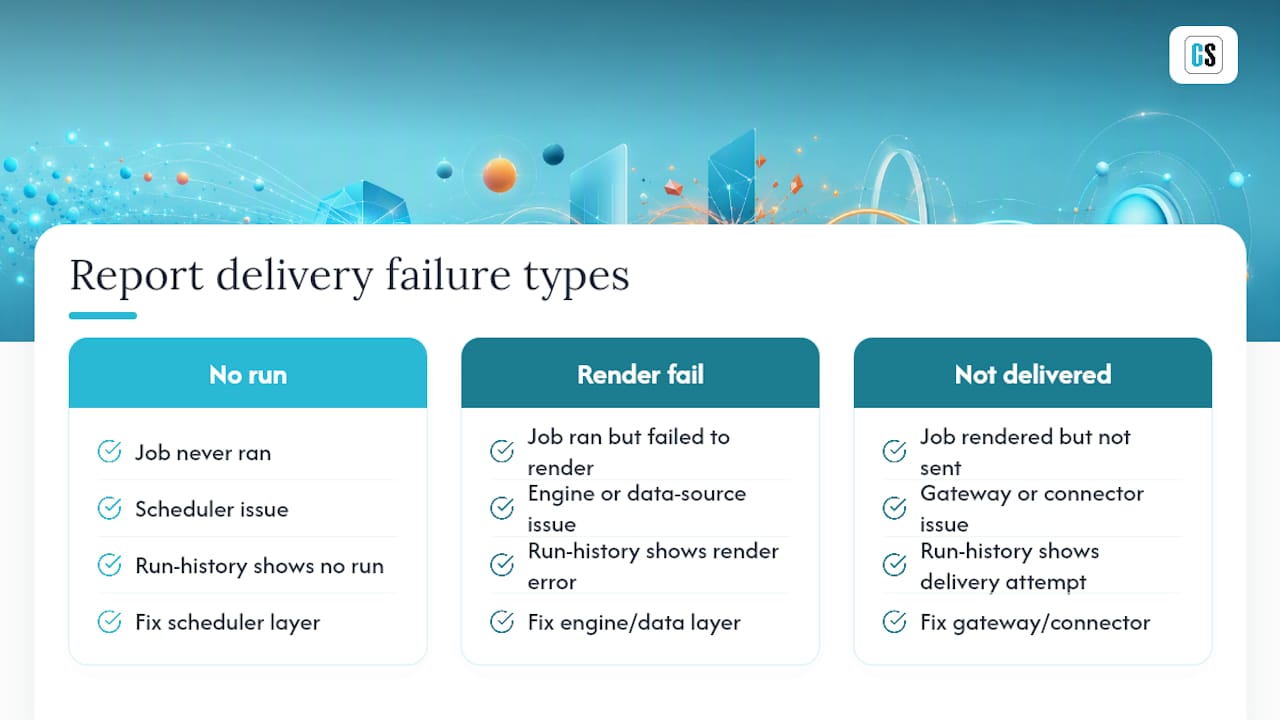
Teams that treat every failure as "the report broke" end up chasing the wrong layer. A missed morning dashboard might look identical to a stalled export, but the run-history log usually tells you within seconds which bucket you're in. That log is the single most useful artifact in the entire triage process, and it's worth building your response process around checking it first, every time.
Immediate Triage Checklist for a Failed Report
Run this within the first 10 minutes of noticing a missed or failed delivery. Speed here limits business impact and preserves the evidence you'll need if the root cause turns out to be intermittent.
- Open the run-history log and record the exact status and error code for the most recent execution.
- Check whether a rendered file exists in the archive or output folder. A missing file points upstream (engine or source); a file that exists but never went out points downstream (gateway or connector).
- Verify the service account credentials haven't expired and check token expiration dates on any connected data sources.
- Check gateway or host health: recent restarts, CPU or memory spikes, or a maintenance window that overlapped the run.
- Assign a named owner to the incident and preserve the logs untouched for post-incident review.
A few things trip teams up during this window:
- Don't restart the schedule before capturing the error code. You'll lose the diagnostic trail.
- Don't assume "it worked yesterday" rules out a credential problem. Tokens can expire mid-cycle.
- Don't skip the archive check. A rendered file that never delivered is a very different problem than one that never rendered at all.
How Do You Diagnose the Root Cause Layer by Layer?
Work down from the scheduler to the model, in that order, rather than guessing at whichever layer seems most likely. Layer-based diagnosis consistently finds the failing point faster than jumping straight to the data source, because scheduler and connector problems are far more common than people assume and much quicker to rule out.
Start with run-history patterns. Then check engine execution logs for step-level errors. Then check connector or gateway logs. The timing pattern tells you a lot before you even open a log file:
- Failure at the same clock time, every day: usually a scheduling conflict, a resource contention window, or a maintenance job colliding with your run.
- Gradual duration drift over weeks: almost always a data volume or model complexity problem, not a one-time bug.
- Sudden failure starting on a specific date: look for a credential expiration, a source schema change, or a recent gateway or connector update.
Common culprits at each layer include expired service account credentials, gateway overload during peak refresh windows, API throttling from the source system, broken query folding, and incremental refresh settings that were never tuned for current data volumes.
For burst deliveries, measure the timestamp spread between your first and last recipient. A wide spread under normal load is a real warning sign about your burst architecture.
Pro Tip: Run a controlled burst test of 100 or more recipients on a low-stakes report before you ever need to trust burst delivery on something business-critical. If the timestamp gap between the first and last delivery stretches past a minute or two, your architecture likely isn't built for burst scheduling at real volume, and you want to know that before the CFO's report is the one that lags.
What Metrics and Alerts Catch Failures Before Users Notice?
The goal isn't more alerts. It's alerts that carry enough context to act on immediately, rather than a wall of noise someone has to decode at 7 a.m.
Track these metrics for every scheduled report:
- Success and failure rate per report, not just system-wide
- Run duration, with attention to drift over time rather than single outliers
- Timestamp spread across recipients for burst jobs
- Recurrence count for the same error code
- Recent retry history and outcome
Monitoring should prioritize early detection over detection sophistication, which in practice means tiering your alerts by business impact. A missed executive dashboard deserves an immediate page. A low-risk internal report that fails once can wait for a daily digest.
The difference between a useful alert and a useless one usually comes down to three fields: which step failed, what the error code was, and who owns the fix. An alert without those three is just a notification that something, somewhere, went wrong.
Teams running dozens of schedules often connect workflow metrics to dashboards using stacks like Prometheus and Grafana, or a vendor's native monitoring, specifically to correlate failure spikes with infrastructure events instead of treating every failure as an isolated case. A partner resource on operational alert design covers similar principles for building control loops that surface problems before they cascade.
When Should You Auto-Retry vs. Escalate for Manual Review?
Not every failure deserves the same response. Transient network blips are usually safe to retry automatically. Credential failures and data integrity errors are not, because retrying blindly can duplicate deliveries or mask a bigger problem.
- Classify the error first. Timeout or network errors: safe for automated retry. Credential, permission, or data errors: route to manual review.
- Apply exponential backoff with a hard cap, typically three to five attempts, and build in an idempotency check so a retry can't send the same report twice.
- For manual recovery, preserve the original artifacts, replay the job in a sandbox environment, and confirm the archive write succeeded before attempting re-delivery.
- Document every incident in run history with a short post-incident note: root cause, corrective action, and whether a policy or schedule change is needed.
Uncontrolled retries can duplicate side effects, which is exactly why the classify-first step matters more than the retry mechanism itself.
Pro Tip: Keep a standing list of "auto-retry safe" error codes reviewed quarterly. New connectors and API versions introduce new error types, and a stale list either retries things it shouldn't or escalates things it doesn't need to.
How Do You Test Delivery Reliability Before a Full Rollout?
Pick two or three critical reports and force a burst run with realistic recipient counts and data volumes before you trust the schedule with production traffic. This is the same 100+ recipient stress test that surfaces bottlenecks aggregate success rates hide.
Acceptance checks should include:
- Timestamp spread between first and last delivery
- Format fidelity across every output type (PDF, Excel, embedded links)
- Zero overload-induced errors under peak-like conditions
- Confirmed archive write for every rendered output
| Test Element | What to Verify |
|---|---|
| Burst volume | 100+ simulated recipients per run |
| Peak timing | Repeated runs during known peak load windows |
| Failover | Gateway failover under simulated outage |
| Dynamic distribution | Recipient list resolves correctly against sample data |
Sample outputs from each test run belong in the archive alongside production files, so you have a known-good baseline to compare against later.
Which Operational Controls Prevent Repeat Failures?
Most repeat failures trace back to a missing owner or an untested change, not a mysterious technical flaw. A handful of governance habits close that gap:
- Assign a named owner to every business-critical schedule, not a shared inbox.
- Require change control review before anyone edits a production schedule.
- Retain run-history logs and rendered outputs long enough to support both troubleshooting and audits.
- Test dynamic recipient lists against sample data before activating them in production.
| Control | Why It Matters |
|---|---|
| Named schedule owner | Cuts investigation time; someone already knows the context |
| Change control on edits | Prevents untested schedule changes from causing new failures |
| Run-history retention | Gives you a baseline to compare current failures against |
| Recipient-list testing | Catches broken distribution logic before it reaches real inboxes |
Set an SLA for detect-and-repair on your most critical reports, and track failures per quarter as a standing metric, not a one-time cleanup project.
Why These Controls Work: Publisher and Product Fit
A well-established BI report automation company has automated BI report delivery across popular platforms for more than two decades, and holds SOC 2 Type II certification. Some platforms build in the run-history logging, delivery confirmation, and burst scheduling that this guide recommends, which is why those controls sit at the center of the checklist above. This article is authored by Christian Ofori-Boateng, drawing on ChristianSteven Software's ongoing work in enterprise BI automation.
The Real Shift Teams Need to Make
Most teams treat report schedules as "set it and forget it." That's backwards. A schedule is an operational asset, and it needs the same ownership and monitoring discipline as any production system. Run a 100-recipient burst test on two critical reports this quarter. Then track failures per quarter and push to resolve them before business windows open, not after.
— Christian Ofori-Boateng
Get Enterprise-Grade Delivery You Can Actually Trust
If you've made it this far, you already know the gap between "the schedule ran" and "every recipient got a correctly formatted report on time" is where most BI teams get burned. Some providers offer on-premises automation built specifically for burst scheduling, run-history logging, and delivery confirmation across popular BI platforms.
The product lines, PBRS for Power BI and SSRS, ATRS for Tableau Reports, and CRD for Crystal Reports, exist specifically to replace the manual scripts and native-tool limitations that cause the failures covered in this guide. If your team is still finding out about missed deliveries from an angry email instead of a run-history log, it's worth seeing the difference firsthand. Start a trial or request a demo through the ChristianSteven Software landing page and put a real burst test on the calendar this quarter.
Sources
- Monitoring workflow processes | Datvero
- AI Auditing 101: Best Practices for Monitoring and Troubleshooting Automated Workflows in 2026 — Tech Daily Shot
- Power BI Refresh Failures: 9 Common Causes and the Fixes
FAQ
What Is the First Step After a Report Delivery Failure?
Check the run-history log for the exact error code and confirm whether the rendered output exists in the archive. That single step usually tells you whether the failure is upstream (rendering) or downstream (delivery).
How Do I Tell a Scheduling Problem From a Gateway Problem?
If the job never appears in run history, it's a scheduling issue. If the job shows as completed but the file never reached the archive or recipient, look at gateway and connector logs next.
Should I Auto-Retry a Failed Report Delivery?
Only for transient errors like network timeouts, and only with a capped, exponential backoff pattern plus an idempotency check. Credential or data errors need manual review, not an automatic retry.
How Many Recipients Should a Burst Test Include?
Run at least 100 simulated recipients and measure the timestamp spread between the first and last delivery. A spread of more than a minute or two under that load signals an architecture that isn't ready for real burst scheduling.
Does ChristianSteven Software Help Prevent Delivery Failures?
Yes. Its platforms, including PBRS, ATRS, and CRD, build burst scheduling, run-history logging, and delivery confirmation directly into the automation layer for Power BI, SSRS, Tableau, and Crystal Reports. Current pricing is available on the ChristianSteven Software site.