
A reporting workflow is a repeatable, structured process that moves a data request from intake through validation to final distribution, ensuring every report reaches the right person with accurate, decision-ready information. Without this structure, teams fall into manual copy-paste routines that introduce errors, blur ownership, and produce reports nobody trusts. The core workflow phases span request intake, KPI definition, dataset readiness, semantic model update, validation, release, and post-release monitoring. Organizations that define these phases clearly produce consistent, error-free reports that align with how leaders actually make decisions.
What is a reporting workflow, and why does it matter?
A reporting workflow is the systematic process that transforms raw data into validated, actionable reports used to support organizational decision-making. The industry also calls this a reporting process, though "workflow" emphasizes the sequential handoffs between people, systems, and approval gates that make the process repeatable.
The distinction matters because most reporting failures are not data problems. They are process problems. A finance team that pulls numbers from three different spreadsheets, reconciles them manually, and emails a PDF every Monday morning has a workflow. It is just an unreliable one. Copy-paste errors and inconsistent metrics consume significant time in BI and finance operations and are the direct result of missing repeatable frameworks.

A well-designed reporting workflow solves this by assigning clear ownership at each phase, defining what "correct" looks like before a report goes out, and separating the job of collecting data from the job of presenting it. That separation is the single most underrated design decision in reporting.
What are the key steps in a reporting workflow?
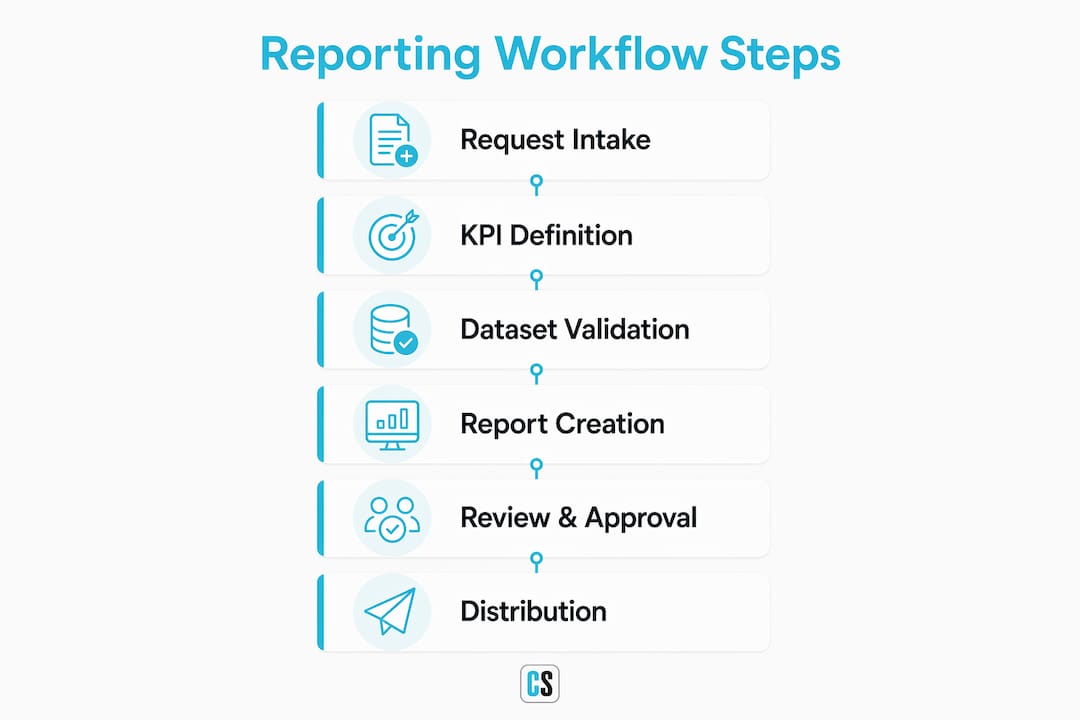
A structured reporting workflow typically runs through five to seven phases. Each phase has a defined owner, a clear input, and a clear output.
- Request intake. A stakeholder submits a reporting need. The team documents the business question, the audience, and the required frequency before any data work begins.
- KPI definition. The team defines every metric: its formula, filters, exclusions, and the data source it draws from. This becomes the metric dictionary entry for that report.
- Dataset readiness. The data engineer confirms the source data is complete, refreshed, and staged in the correct layer. No report work starts until this gate clears.
- Semantic model update. Analysts build or update the data model, connecting the staged data to the report template without mixing raw data into the presentation layer.
- Validation. Automated checks run against the output. Null values, impossible figures, and statistical outliers trigger an exception flag for human review.
- Release. A designated owner signs off and the report is distributed to the defined audience in the correct format and at the correct time.
- Post-release monitoring. The team tracks whether the report is being used, whether the data source has changed, and whether the business question it answers is still relevant.
Pro Tip: Document the metric dictionary before you build the report, not after. Defining formula, filters, and exclusions upfront prevents the metric conflicts that surface six months later when two departments cite different revenue numbers.
Each step should have a named owner, not a team. Shared ownership is no ownership.
How does automation improve reporting workflows in 2026?
Automation removes the manual handoffs that slow down reporting and introduce errors. A mature automated workflow uses scheduled triggers to pull data, validate it, populate a template, generate a draft summary, route exceptions for human review, deliver the final report, and write an audit log entry. That eight-step AI-assisted workflow replaces what most teams currently do with a combination of spreadsheets, email threads, and calendar reminders.
The benefits of automating the reporting process are concrete:
- Reduced manual effort. Scheduled data extraction and template population eliminate repetitive tasks that analysts perform every reporting cycle.
- Faster delivery. Reports reach stakeholders at a defined time, not whenever someone finishes building them.
- Fewer errors. Automated validation gates catch null values, impossible figures, and outliers before distribution, not after.
- Audit trails. Every automated run produces a log entry, which is critical for compliance and for diagnosing data issues after the fact.
- Consistent formatting. Templates enforce layout and branding standards without manual intervention.
One design principle drives all of this: separate raw data staging from report templates. Mixing data ingestion and presentation in the same layer means a source change breaks the report in ways that are hard to trace. Keeping them separate means a broken data feed is a data problem, not a reporting problem.
AI adds a useful layer on top of automation. AI tools can draft narrative summaries, flag anomalies that fall outside expected ranges, and suggest which metrics changed most significantly in a given period. However, AI-driven workflows require explicit guardrails in prompt construction to prevent fabricated figures from reaching executive distribution. Human sign-off on AI-generated content is not optional. It is the control that keeps the workflow trustworthy.
Pro Tip: Set validation rules that define what "normal" looks like for each KPI before you automate delivery. A rule that flags any week-over-week revenue change above 30% costs nothing to configure and catches the errors that matter most.
Tools like Power BI report automation and scheduling platforms built for enterprise BI environments handle the scheduling, formatting, and delivery layers so analysts focus on interpretation rather than distribution logistics. AI productivity research shows that AI-assisted workflows deliver measurable ROI when human oversight is built into the process from the start.
Why does ownership and governance matter in reporting workflows?
Governance is what separates a reporting workflow from a reporting habit. A habit produces reports. A workflow produces reports that people trust.
Structured management reporting frameworks reduce noise by defining five governance elements: report hierarchy, audience mapping, content standards, cadence, and ownership. Each element answers a specific question that, left unanswered, creates confusion.
| Governance element | The question it answers |
|---|---|
| Report hierarchy | Which reports are strategic, operational, or tactical? |
| Audience mapping | Who receives each report, and at what level of detail? |
| Content standards | What metrics are included, and how are they defined? |
| Cadence | How often does each report publish, and why? |
| Ownership | Who is accountable for accuracy at each stage? |
Without these definitions, two departments will eventually publish different numbers for the same metric. That conflict destroys trust in the data and, by extension, in the people who produce it.
A metric dictionary is the most practical governance tool available. It documents each KPI's formula, data source, filters, exclusions, and the name of the person who owns it. When a metric conflict surfaces, the dictionary is the reference that resolves it. Without one, the resolution becomes a political negotiation rather than a factual one.
Financial close and reporting workflows also need separate ownership. Close produces locked numbers. Reporting tells the story those numbers represent. Blurring the two creates situations where a report goes out before the underlying data is final, which is one of the most common and most damaging reporting failures in finance operations.
What best practices make reporting workflows decision-useful?
Decision-usefulness is the primary goal of any reporting workflow. A report that is visually polished but answers the wrong question fails. A report that answers the right question in a plain table succeeds.
These practices separate workflows that deliver insight from those that deliver noise:
- Prune vanity metrics. If a metric does not connect to a decision someone makes, remove it. Every metric added to a report increases the cognitive load on the reader and dilutes the signal.
- Align cadence with decision cycles. A weekly sales report makes sense if sales leaders make weekly decisions. A daily report for a metric reviewed monthly creates work without value.
- Use validation gates before every release. Automated checks that route anomalies for human review prevent bad data from reaching executives silently. Silent failures are the most dangerous kind because nobody knows to question the numbers.
- Require manual sign-off on exceptions. Automation handles the routine. Humans handle the unusual. That division of labor is what makes the workflow trustworthy at scale.
- Log every run. Audit logs let you trace exactly what data fed a report, when it ran, and who received it. This is non-negotiable for regulated industries and genuinely useful for everyone else.
- Review the workflow itself on a defined schedule. Business questions change. Data sources change. A workflow that was correct six months ago may now answer a question nobody is asking.
Pro Tip: When building AI-assisted summaries into your workflow, write the prompt as if you are briefing a new analyst. Specify the metrics, the comparison period, the audience, and the tone. Vague prompts produce vague summaries that require more editing than writing from scratch.
Improving reporting efficiency is not about producing more reports faster. It is about producing fewer, better reports that reach the right people at the right time with the right level of detail.
Key Takeaways
A reporting workflow succeeds when it separates data ingestion from presentation, assigns named owners at every phase, and measures success by decision-usefulness rather than report volume.
| Point | Details |
|---|---|
| Define phases before building | Map all 5–7 workflow stages and assign a named owner to each before writing a single query. |
| Separate ingestion from presentation | Keep raw data staging and report templates in distinct layers to prevent copy-paste drift. |
| Automate validation, not judgment | Use automated gates to catch bad data, but require human sign-off before distributing exceptions. |
| Govern with a metric dictionary | Document every KPI's formula, filters, and owner to resolve conflicts with facts, not politics. |
| Measure by decision-usefulness | Cut vanity metrics and align report cadence with the actual decision cycles of your audience. |
What I have learned from watching reporting workflows fail
The most common failure I see is not a technology problem. It is a boundary problem. Teams blur the line between data ingestion and report presentation, and then wonder why a source change breaks three reports in ways nobody can trace. The fix is architectural, not technical. Draw a hard line between the layer that collects data and the layer that displays it, and enforce that line as a governance rule.
The second failure is ownership by committee. When a report belongs to "the analytics team," it belongs to nobody. The first time a number looks wrong, everyone points at someone else. Naming a single person as accountable for each report changes the dynamic completely. That person asks harder questions during validation because their name is on the output.
Automation is genuinely powerful, but I have watched teams automate bad workflows and simply produce bad reports faster. The sequence matters. Fix the process first. Automate second. A scheduled Power BI delivery that pushes a report with a broken metric definition to 200 executives every Monday morning is worse than no automation at all.
The trend toward AI-assisted reporting is real and worth pursuing. But AI-based reporting requires explicit guardrails and human review before anything reaches a decision-maker. The organizations getting this right are not the ones with the most sophisticated AI. They are the ones with the clearest process for when a human must step in.
— Bobbieann Gordon
How ChristianSteven Software automates your reporting workflow
ChristianSteven Software has spent more than two decades turning complex reporting workflows into reliable, hands-free processes for enterprise teams. Its products handle the scheduling, formatting, and distribution layers that consume the most manual effort in a typical reporting cycle.
PBRS automates Power BI report scheduling and delivery, pushing the right report to the right person in the right format on a defined schedule. ATRS does the same for Tableau report automation, eliminating the manual export and email steps that slow distribution. IntelliFront BI adds real-time KPI dashboards for teams that need live visibility between scheduled report cycles. All products carry SOC 2 Type II certification, which means the automation layer meets the security and reliability standards that enterprise governance requires.
FAQ
What is a reporting workflow in simple terms?
A reporting workflow is a defined, repeatable process that takes a data request through intake, validation, and distribution to produce a consistent, accurate report. It assigns ownership at each step and uses quality checks to prevent bad data from reaching decision-makers.
How many steps does a typical reporting workflow have?
A standard reporting workflow runs through five to seven phases: request intake, KPI definition, dataset readiness, semantic model update, validation, release, and post-release monitoring. Simpler workflows may combine some phases; regulated environments often add additional sign-off steps.
What is the difference between a reporting workflow and financial close?
Financial close and reporting workflows are adjacent but distinct processes. Close locks the numbers; reporting translates those numbers into decision-useful stories for specific audiences. They need separate owners and separate quality controls.
Why should I automate my reporting workflow?
Automation removes manual copy-paste steps, enforces consistent formatting, and delivers reports on a defined schedule without human intervention. Validation gates built into automated workflows catch data errors before distribution, which reduces the risk of bad numbers reaching executives.
What is a metric dictionary, and do I need one?
A metric dictionary is a document that defines each KPI's formula, data source, filters, exclusions, and named owner. Any organization with more than one team producing reports needs one. Without it, metric conflicts are resolved by opinion rather than by fact.