
For enterprise teams that need on‑prem, formatted BI report delivery. ChristianSteven Software is the strongest PushMetrics alternative, thanks to its native connectors for Power BI, Tableau, SSRS, and Crystal Reports plus SOC 2 Type II certification. If your needs skew differently, look at cloud BI platforms like Domo, Qlik, or Looker; orchestration tools like Kestra or Shipyard; or observability platforms like Dynatrace and Datadog for infrastructure monitoring instead of formatted reports.
TL;DR:
- ChristianSteven Software is ideal for on-prem or hybrid environments that require precise, formatted report exports from Power BI, Tableau, SSRS, or Crystal Reports.
- The platform's native connectors and SOC 2 Type II certification ensure reliable, secure scheduled delivery, especially for complex formatting needs.
- When evaluating alternatives, prioritize tools that support native BI connectors, high formatting fidelity, data-driven scheduling, and enterprise security certifications.
- Monitoring tools like Dynatrace and Datadog are not suitable substitutes as they focus on system performance rather than formatted report distribution.
- Cloud BI platforms like Domo and Looker excel at dashboards and interactive analytics but lack robust features for scheduled, formatted report exports in complex enterprise scenarios.
Table of Contents
- Top PushMetrics Alternatives Worth Evaluating
- How Do You Evaluate PushMetrics Alternatives?
- Why ChristianSteven Software Fits PushMetrics-Style Use Cases
- What Do Customer Reviews and Case Studies Show?
- How Easy Is Each Platform to Actually Use?
- What Should You Expect From Support and Service?
- Can the Platform Scale With Your Reporting Volume?
- How Do Feature Sets Really Compare?
- Category Confusion: Monitoring Tools Aren't Report Delivery Tools
- How to Evaluate ChristianSteven Software (Demo and Pilot Options)
- Sources
- FAQ
Top PushMetrics Alternatives Worth Evaluating
PushMetrics comparisons on sites like G2 throw a wide net, mixing report automation tools with monitoring platforms and general analytics suites. That's useful for browsing, but not for buying. Here's what each option actually does, so you can match capability to your specific reporting job.
- ChristianSteven Software (PBRS, ATRS, CRD, IntelliFront BI) — On‑prem and hybrid report automation built specifically around Power BI, Tableau, SSRS, and Crystal Reports. Best for enterprise teams that need complex export formatting, event-driven scheduling, and on‑prem deployment control. Standout: native BI connectors paired with SOC 2 Type II compliance.
- Dynatrace — Full-stack observability platform for application performance. Best for infrastructure and app monitoring teams, not formatted report delivery. Standout: AI-driven performance insights across cloud environments.
- Domo — Cloud-native BI platform with built-in dashboards and data apps. Best for organizations that want executive dashboards without managing on‑prem infrastructure. Standout: end-to-end cloud BI with prebuilt connectors.
- SolarWinds Observability — Monitoring suite for infrastructure and application telemetry. Best for ops teams tracking system health, not for scheduled report distribution. Standout: unified telemetry dashboards.
- Datadog — Real-time monitoring across infrastructure, apps, and logs. Best for incident response and system alerting. Standout: unified metrics, traces, and logs in one pane.
- IBM Instana — APM built for cloud-native, microservices-heavy environments. Best for teams needing low-latency performance tracing. Standout: automatic distributed tracing and topology mapping.
- Sourcetable — Spreadsheet-style platform for no-code data queries. Best for analysts who want familiar spreadsheet logic wired to live data sources. Standout: spreadsheet UI with business data connectors.
- Alteryx — Low-code data preparation and analytics workflow platform. Best for data teams running heavy ETL before reporting even starts. Standout: strong workflow automation for data prep.
- Kestra — Orchestration platform for scheduling data workflows. Best for engineering teams managing complex, multistep pipelines. Standout: event-driven orchestration.
- Qlik — BI platform with an associative analytics engine. Best for interactive exploration and embedded analytics inside other apps. Standout: associative engine that lets users pivot without predefined queries.
- Shipyard — Operations-focused data automation platform. Best for teams operationalizing workflows across disconnected systems. Standout: integration-first automation design.
- Looker — Google Cloud's BI platform with LookML data modeling. Best for teams standardizing metrics definitions across a modern cloud data stack. Standout: LookML modeling layer for consistent embedded analytics.
Pro Tip: Sort your shortlist by which BI tool actually produces your source reports first, not by review score. A platform with a 4.8-star rating that can't natively pull from Crystal Reports will cost you more in workaround engineering than a lower-profile tool that connects on day one.
How Do You Evaluate PushMetrics Alternatives?
Five criteria separate a genuine BI report automation replacement from a tool that just showed up on a competitor list. Rank vendors against each before you schedule a demo.
- BI connectors and data sources. Does the tool natively pull from Power BI, Tableau, SSRS, Crystal Reports, or your warehouse, or does it require middleware?
- Export formatting fidelity. Can it preserve layout, pagination, and branding in PDF, Excel, and CSV exports, or does it flatten formatting?
- Scheduling and event triggers. Does it support dynamic, data-driven schedules (not just fixed daily/weekly jobs) and event-based triggers?
- Delivery channels. Can it route reports to email, Slack, SFTP, cloud storage, and APIs, matching how your recipients actually work?
- Security and compliance. Does it support SAML or SCIM, role-based access, and independent certifications like SOC 2?
Bring these questions into vendor calls:
- Which BI platforms and data warehouses connect natively, without a custom API build?
- What happens to report formatting when exported to PDF or Excel, specifically for multipage or financial layouts?
- Can schedules trigger off a data condition, not just a clock?
- What's the failover process when a delivery fails or a data source times out?
- What certifications and access controls does the platform carry today?
Three red flags should end a conversation fast: no native BI connectors (everything routes through generic APIs), no real formatting controls (exports look nothing like the source report), and no enterprise authentication support like SAML or SCIM. For a deeper walkthrough of scheduling logic, see this guide on automating and scheduling report generation with BI tools.
Pro Tip: Ask for a live export test during the demo, not a slide deck. Formatting problems only show up when you actually generate a PDF from a real multi-tab report.
Why ChristianSteven Software Fits PushMetrics-Style Use Cases
ChristianSteven Software built four products around one job: getting the right report to the right person, correctly formatted, on schedule. PBRS handles Power BI exports and distribution. ATRS covers Tableau report automation. CRD manages Crystal Reports scheduling and delivery. IntelliFront BI adds real-time dashboards and KPI tracking on top.
The company has spent more than two decades focused on this exact workflow, and holds SOC 2 Type II certification, a meaningful signal for IT teams that need to document vendor security posture during procurement. That combination matters most in three scenarios: on‑prem environments where cloud-only tools aren't an option, complex formatting requirements like multipage financial statements, and event-driven distribution where reports need to fire off a data change rather than a fixed clock.
For regulated industries with strict formatting and audit needs, see how Crystal Reports scheduling supports healthcare reporting requirements.
What Do Customer Reviews and Case Studies Show?
Community review aggregates function as an industry signal, not a verdict. A high review count on a G2-style listing tells you a tool is widely adopted; it doesn't tell you whether that tool fits a reporting job that requires Crystal Reports export fidelity or SSRS scheduling logic.
Buyers researching PushMetrics alternatives should read case studies for the specific workflow they're replacing, not the vendor's general customer satisfaction score. A monitoring platform can have excellent reviews from infrastructure teams while being a poor fit for finance teams needing formatted PDF statements delivered on a monthly close schedule. Match the review context to your use case: look for customers in similar industries running similar BI stacks, not just high star counts. When a vendor's case studies all describe dashboard viewing rather than scheduled export delivery, that's a sign the tool solves a different problem than the one you're evaluating it for.
How Easy Is Each Platform to Actually Use?
Ease of use splits along two lines: how fast an analyst can build a report distribution job, and how much IT involvement it takes to maintain one. Spreadsheet-style tools like Sourcetable lower the entry barrier for ad hoc queries but can struggle once you need repeatable, governed distribution across dozens of recipients.
Low-code platforms like Alteryx and orchestration tools like Kestra reward technical users willing to build workflows, but that same flexibility means a steeper ramp for business analysts who just need a report to land in an inbox every Monday morning. On‑prem BI automation tools built around scheduling and formatting, by contrast, tend to front-load setup complexity (defining schedules, formats, and destinations once) in exchange for near-zero ongoing effort afterward. If your team turns over report requests weekly, prioritize a platform where a non-technical user can clone an existing schedule rather than build one from scratch each time.
What Should You Expect From Support and Service?
Support quality tends to track company focus more than company size. General observability platforms like Dynatrace and Datadog run large support organizations, but tickets about report formatting or BI connector issues can get routed through tiers built for infrastructure incidents, not reporting workflows.
Vendors built specifically around BI report automation typically staff support around the exact failure modes that matter here: a broken data connection, a formatting mismatch after a source report update, or a delivery failure to a specific channel. Before buying, ask what the support SLA looks like for a failed scheduled delivery, not just uptime. A dashboarding platform's excellent infrastructure support doesn't help you when a Tuesday morning finance report silently fails to export in the right currency format.
Can the Platform Scale With Your Reporting Volume?
Scalability questions split into two categories: how many reports and recipients the platform handles, and how it performs under peak scheduling load, like every report firing at month-end close.
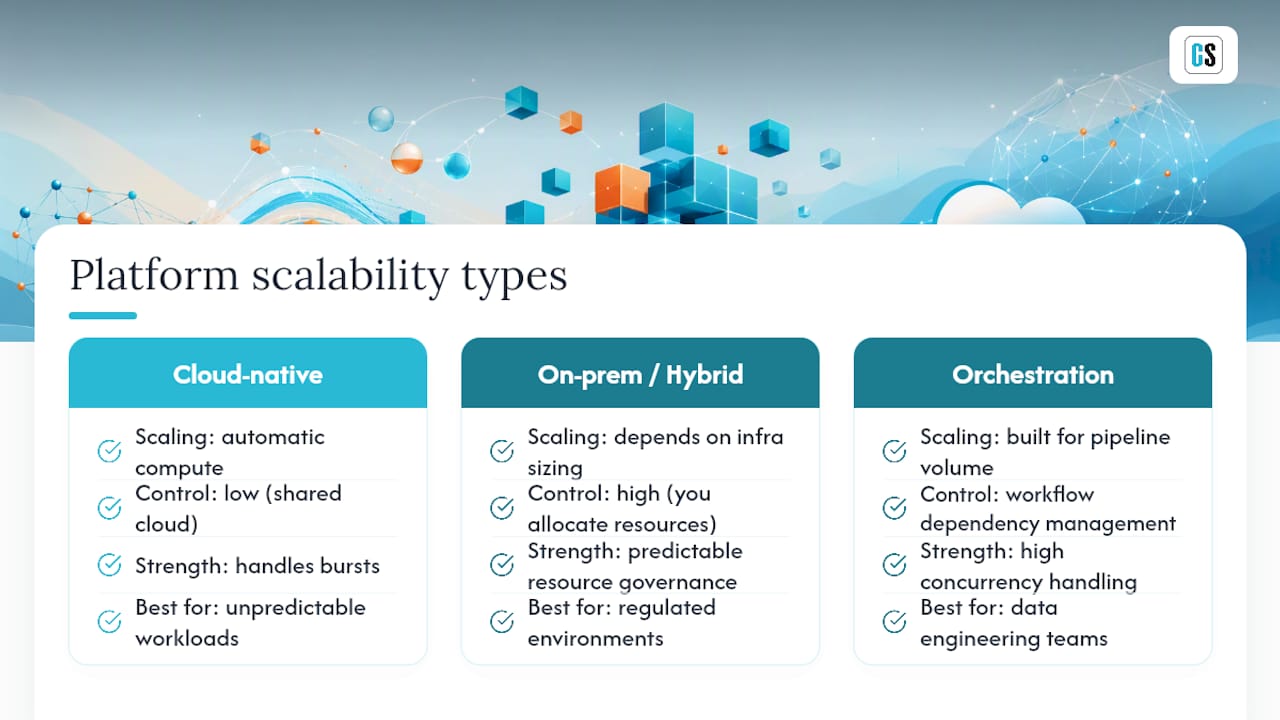
Cloud-native platforms like Domo and Looker generally scale compute automatically, which suits organizations with unpredictable analytics workloads. On‑prem and hybrid tools scale differently: performance depends more on your own infrastructure sizing, but you gain control over exactly when and how resources get allocated, which matters for regulated environments that can't burst to shared cloud compute. Orchestration platforms like Kestra and Shipyard are built to handle high pipeline volume with dependency management, which suits data engineering teams more than report distribution teams. Whatever you choose, ask specifically how the platform behaves when 200 scheduled reports all trigger within the same 30-minute window at quarter close. That's the scenario that exposes weak scheduling architecture.
How Do Feature Sets Really Compare?
The functional gap between these tools comes down to output, not just features on a spec sheet. BI report automation tools like ChristianSteven Software's suite are built to produce a formatted, exportable document (PDF, Excel, CSV) on a schedule or trigger. Monitoring platforms like Dynatrace, Datadog, IBM Instana, and SolarWinds Observability are built to surface real-time alerts and performance graphs, not paginated reports.
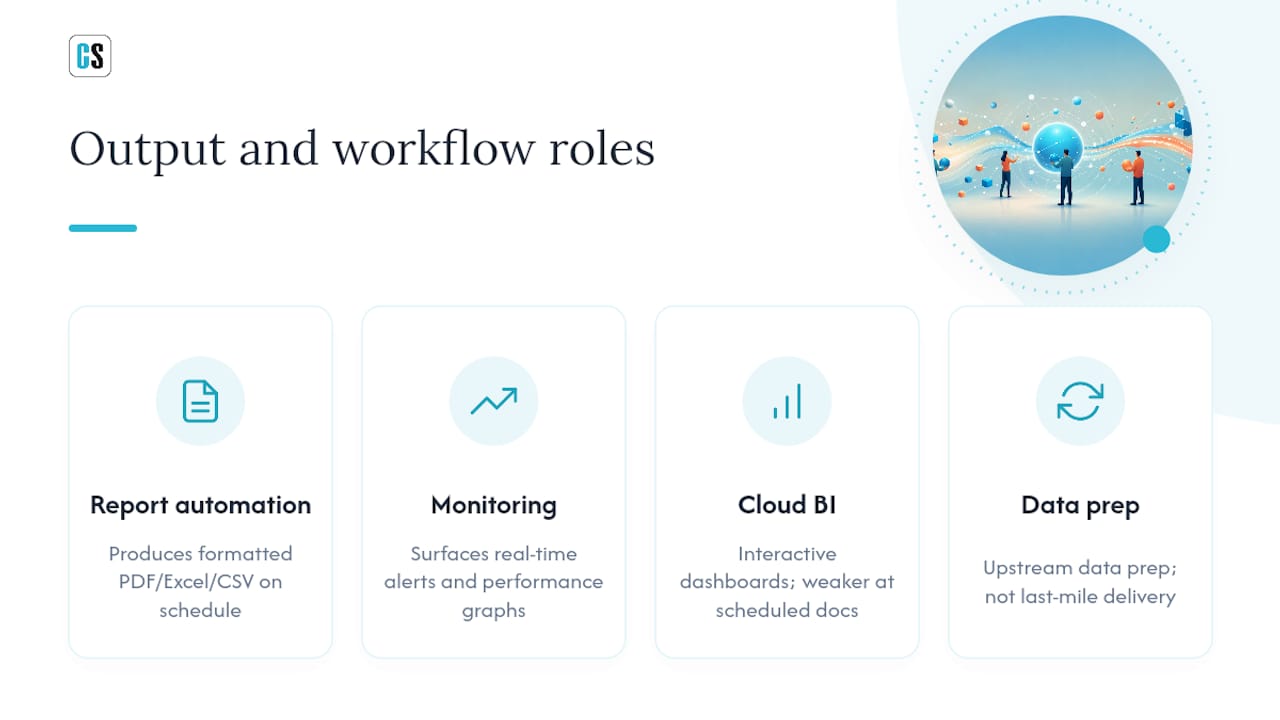
Cloud BI platforms like Domo, Qlik, and Looker sit in between: strong at interactive dashboards and embedded analytics, weaker at formatted, scheduled distribution to large recipient lists in specific file formats. Data prep and orchestration tools like Alteryx, Kestra, and Shipyard operate upstream, getting data ready or pipelines running, rather than handling the last-mile job of getting a finished report into someone's inbox. According to Tracxn's competitive tracking, the sheer range of vendor types buyers compare here (from Sourcetable to Alteryx to Looker) confirms there's no single "PushMetrics category." There's a job to be done, and each vendor covers a different slice of it.
Category Confusion: Monitoring Tools Aren't Report Delivery Tools
Software marketplaces frequently lump BI automation in with APM and push platforms simply because they share the word "alerts" or "delivery." A G2 comparison can list Dynatrace next to a report scheduler, but Dynatrace won't export a formatted quarterly statement. Choose an APM tool like Datadog for system health; choose a BI automation tool when the job is recurring, formatted report delivery.
Marketplace alternative lists optimize for category tags and review volume, not feature parity. That's a gap worth understanding before you shortlist anything, and it's the single most common reason buyers end up demoing the wrong tool.
How to Evaluate ChristianSteven Software (Demo and Pilot Options)
If your team is comparing PushMetrics alternatives because you need formatted reports leaving Power BI, Tableau, SSRS, or Crystal Reports on a reliable schedule, ChristianSteven Software solves that specific problem rather than a broader monitoring or dashboarding one. It runs on‑prem or hybrid, carries SOC 2 Type II certification, and connects natively to the BI stacks most enterprise reporting teams already run.
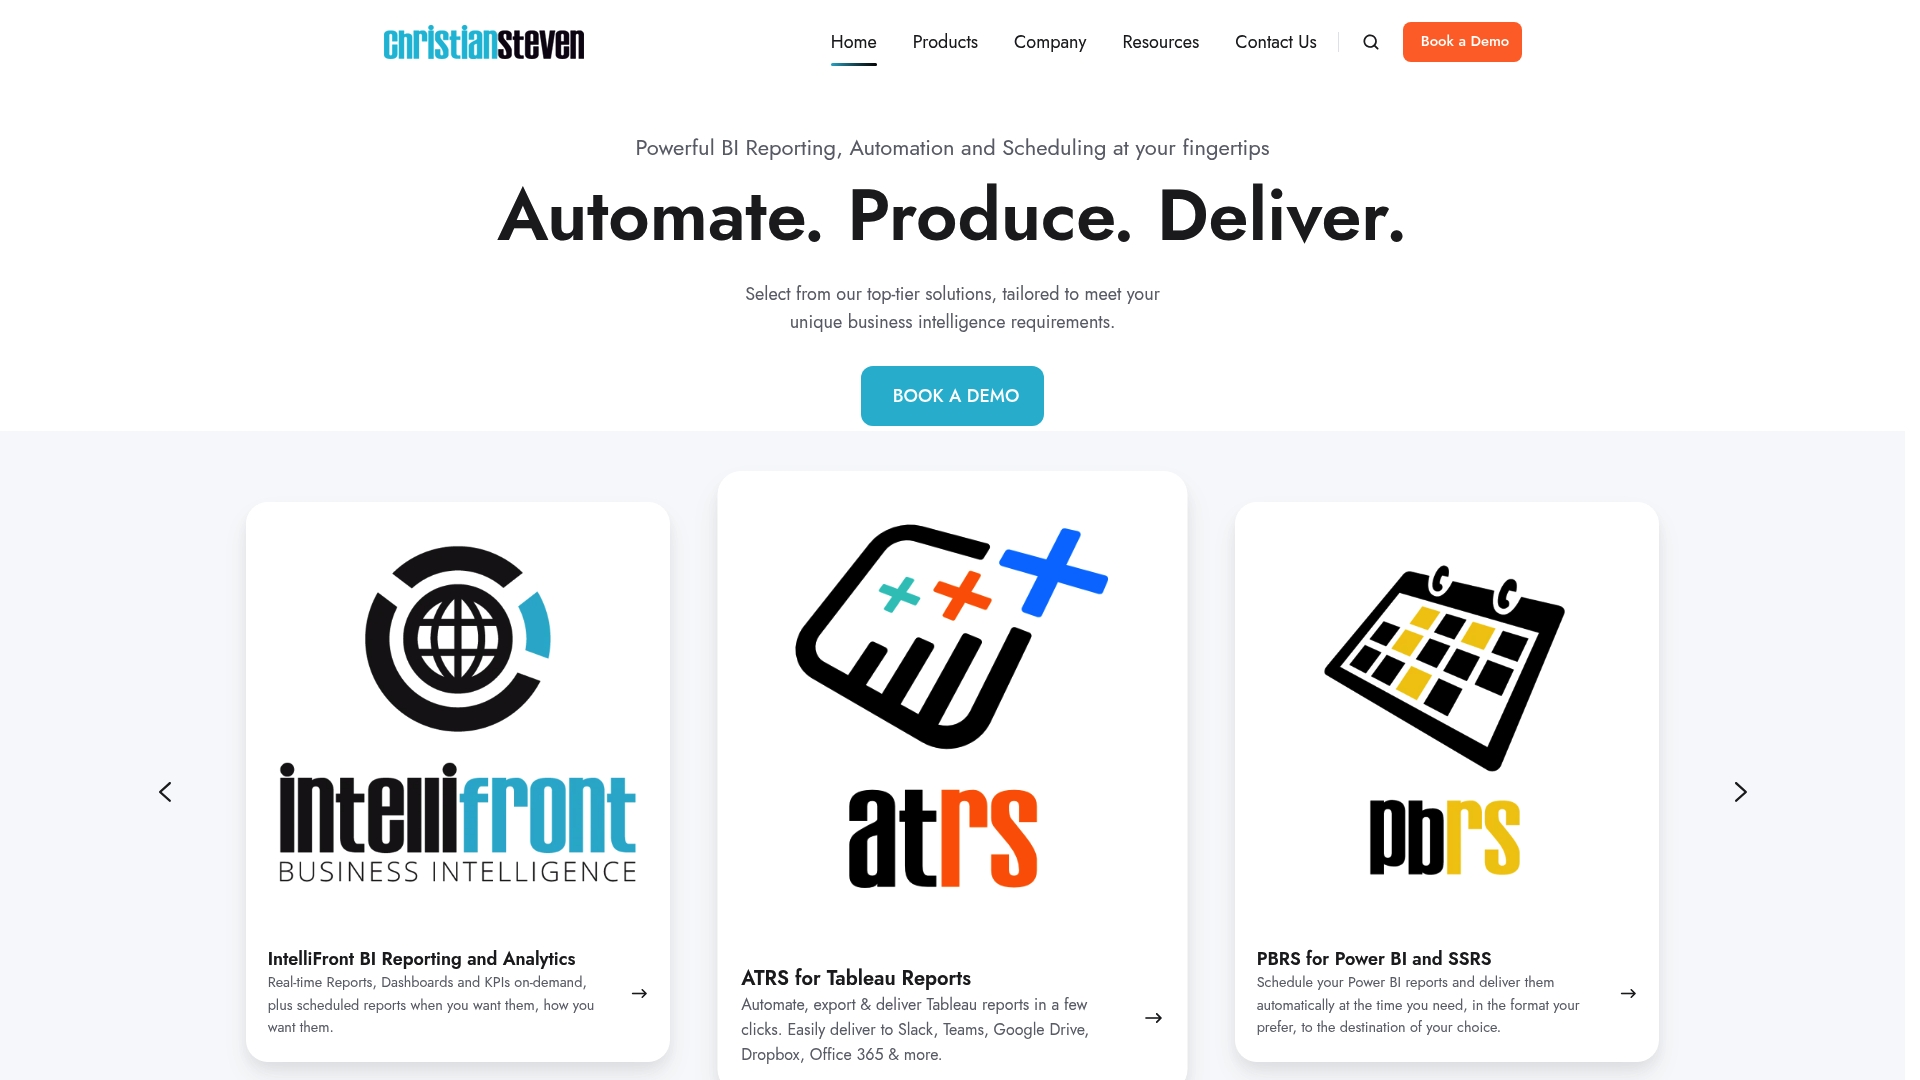
A demo typically walks through your actual source reports, not a generic sample deck, so you see real formatting fidelity before committing. Two starting points:
- Automate Power BI report exports with PBRS, for teams whose reports originate in Power BI.
- Automate Tableau report delivery with ATRS, for teams standardized on Tableau.
A practical way to test fit: run a 30-day pilot using two or three of your actual production reports, exported in the exact formats and destinations your recipients need. If the pilot reproduces your existing report layouts correctly on the first try, you've already answered the question a generic monitoring tool never could.
Sources
- PushMetrics competitors & alternatives — G2
- PushMetrics — Tracxn company profile
- Firebase Cloud Messaging documentation — Google
FAQ
What Is the Best PushMetrics Alternative for Enterprise BI Reporting?
ChristianSteven Software is a fit for enterprise teams needing on‑prem, formatted report delivery from Power BI, Tableau, SSRS, or Crystal Reports with security compliance features.
Are Dynatrace and Datadog True PushMetrics Alternatives?
Not for report delivery. Dynatrace, Datadog, and similar platforms specialize in application performance monitoring, not formatted, scheduled BI report export.
Can Push Notification Platforms Like Firebase Replace BI Report Automation?
No. Firebase Cloud Messaging delivers targeted messages and payloads at scale but has no formatted-report export capability required for enterprise BI delivery.
Which Alternatives Support On‑Prem Deployment?
ChristianSteven Software is built for on‑prem and hybrid deployment. Most cloud-native BI platforms like Domo and Looker run cloud-only, with limited on‑prem options.
How Do I Choose Between BI Automation Tools and Orchestration Platforms?
Choose a BI automation tool when the deliverable is a formatted report on a schedule; choose orchestration platforms like Kestra or Shipyard when the job is managing complex, multi-step data pipelines upstream of reporting.