
Automated reporting is the process of using software to collect, process, and distribute business data into formatted reports without continuous manual intervention. The system pulls from your sources, validates the data, generates the report, and delivers it to the right people on a schedule or trigger. No one has to remember to run it.
Three reasons this matters right now:
- Time savings: Teams that previously spent hours compiling and formatting reports manually can redirect that time to analysis and decisions.
- Error reduction: Manual data entry carries meaningful error risk; automation removes most of those failure points by eliminating repetitive copy-paste steps.
- Consistency and scale: The same report logic runs every time, for every recipient, whether you are distributing to five people or five hundred.
Table of Contents
- What does automated reporting actually cover?
- How does automated reporting work? The core workflow
- What are the real benefits of automated reporting?
- What types of automated reports should you know about?
- Which tool categories power automated reporting?
- How do you implement automated reporting? A practical checklist
- Real-world automated reporting examples by function
- What does implementation actually cost and when do you see ROI?
- What pitfalls and governance gaps kill automated reporting programs?
- How ChristianSteven Software maps to your automated reporting workflow
- Key Takeaways
- The case for starting smaller than you think
- Ready to cut manual reporting time with ChristianSteven Software?
- FAQ
What does automated reporting actually cover?
Automated reporting handles the mechanical work: scheduled data extraction, template-based generation, formatting, and multi-channel delivery. What it does not replace is strategic interpretation. An analyst still decides which metrics matter, what the trend means for Q3 planning, and when an anomaly warrants a call with the CFO.
A concrete comparison makes this clear. In a manual weekly marketing report workflow, a marketing analyst pulls data from Google Analytics, the CRM, and a paid-media dashboard, pastes it into a spreadsheet, formats it, writes a summary, and emails it every Monday morning. That process takes roughly two hours and depends entirely on one person showing up. In an automated version, the same data sources feed a report template on a schedule. The report generates at 6:00 AM Monday and lands in every stakeholder's inbox before they open their laptop. The analyst's job shifts from data assembly to reviewing the output and flagging anything that needs context.
The common misconception is that automation replaces analysts. It does not. It shifts their role from report creators to exception handlers, which is a better use of their skills. The interpretation, the judgment calls, the ad-hoc deep-dive analysis when a number looks wrong — those stay human.
How does automated reporting work? The core workflow
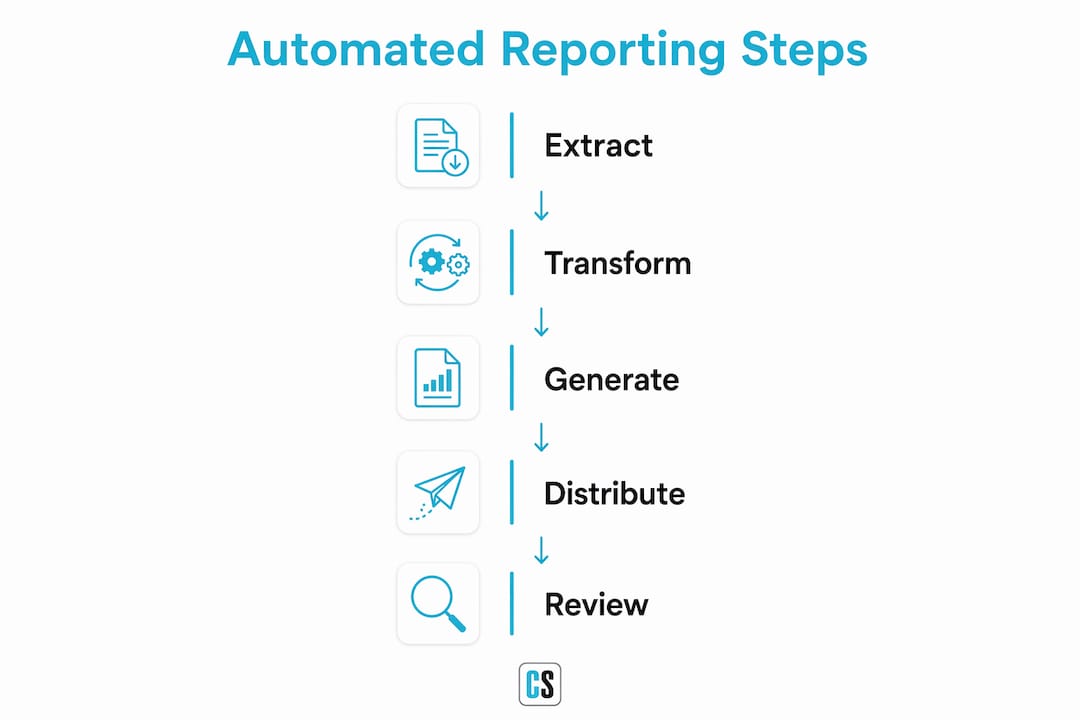
A standard automated reporting workflow follows five steps, and every tool you evaluate should map to all of them.
- Extract and connect. The system pulls data from source systems: ERPs like SAP or Oracle, CRMs like Salesforce, relational databases, cloud storage, spreadsheets, and REST APIs. Connector availability is often the first thing to check when evaluating a platform.
- Transform and validate. Raw data rarely arrives clean. This step applies business logic, joins tables, filters records, and runs validation checks to catch nulls, duplicates, or out-of-range values before they reach the report.
- Generate from a template. The validated data populates a pre-built template, whether that is a Power BI layout, a Crystal Reports format, a Tableau workbook, or a custom dashboard. The template controls what the output looks like every time.
- Distribute and archive. The finished report goes out via email, Slack, a shared drive, a web portal, or a webhook. A copy is archived for audit and version history. Modern platforms support multi-channel delivery including PDF attachments, embedded HTML, and direct dashboard links.
- Monitor and retry. The system logs every run, flags failures, and retries on configurable schedules. Without this step, a broken connector silently stops delivery and no one knows until a stakeholder complains.
The data flow looks like this: source systems (ERP, CRM, databases) feed into an ETL or automation layer, which passes clean data to the report engine, which pushes output to recipients and an archive. Each handoff is logged.
Pro Tip: Map your data sources before you pick a tool. A platform with 50 connectors is useless if none of them match your ERP.

What are the real benefits of automated reporting?
The benefits of automated reporting are measurable, not theoretical. The most direct one is time. Teams that previously spent significant hours each week compiling and formatting reports can redirect that capacity to analysis once reporting is automated. That is not a small shift — it changes what analysts actually do with their days.
Accuracy improves for a structural reason: the same logic runs every time. There is no risk of a formula being overwritten in a spreadsheet, a column being pasted into the wrong row, or a filter being forgotten. The reduction in manual data entry errors is one of the most cited reasons finance and operations teams push for automation first.
Stat to know: Gartner found that robotic process automation can save finance departments significant full-time equivalent hours annually by eliminating repetitive manual tasks — and reporting is among the highest-volume of those tasks.
Consistency matters more than most teams realize until they lose it. When reports are built manually by different people on different days, the numbers can diverge based on filter choices, date ranges, or data refresh timing. Automated reports use the same parameters every run, which means stakeholders are comparing apples to apples across periods.
Scalability is the benefit that compounds. Adding a new recipient, a new region, or a new report frequency in a manual process means more labor. In an automated system, it means changing a configuration. You can find a detailed breakdown of how self-service reporting reduces labor costs in practice, but the short version is: the marginal cost of one more report approaches zero once the infrastructure is in place.
What types of automated reports should you know about?
Not all automated reports work the same way. The delivery mode you choose should match the use case, not just the tool you happen to have.
- Scheduled/batched reports run on a fixed cadence: daily, weekly, monthly. Best for recurring operational reviews, financial statements, and compliance reports where the audience expects a consistent delivery time.
- Triggered/alert-driven reports fire when a condition is met: a KPI crosses a threshold, a transaction exceeds a limit, or a data anomaly is detected. Best for exception management and real-time escalation.
- Real-time dashboards refresh continuously or on short intervals, giving stakeholders a live view of metrics without waiting for a scheduled run. Best for operations centers, sales floors, and customer success teams monitoring active queues.
- Ad-hoc automated reports let users request a report on demand using a pre-built template, without involving IT or an analyst. Best for self-service environments where business users need flexibility without custom development.
| Type | Best use cases | Typical delivery channels |
|---|---|---|
| Scheduled/batched | Financial statements, compliance, weekly ops reviews | Email, shared drive, PDF |
| Triggered/alert-driven | KPI threshold breaches, fraud flags, SLA violations | Email, Slack, SMS, webhook |
| Real-time dashboards | Sales tracking, operations monitoring, support queues | Web portal, embedded dashboard |
| Ad-hoc automated | Self-service analysis, on-demand executive summaries | Email, web portal, download |
Which tool categories power automated reporting?
Automated reporting is rarely one product. It is a stack of capabilities, and understanding the categories helps you evaluate what you already have versus what you need.
ETL/ELT tools handle data movement and transformation. They connect to source systems, apply business logic, and load clean data into a warehouse or reporting layer. Examples include open-source options built on Python with pandas for custom pipelines, or commercial platforms with visual connectors.
BI platform schedulers sit on top of tools like Power BI, Tableau, or SSRS and handle the generation and distribution layer. They control when reports run, who gets them, in what format, and via which channel. This is where purpose-built tools like those from ChristianSteven Software operate. For teams evaluating out-of-system schedulers for SSRS, the advantage is flexibility that the native scheduler cannot provide.
Dashboard platforms like Power BI and Tableau provide the visualization and template layer. They generate the output; the scheduler controls the delivery.
Orchestration and RPA platforms coordinate multi-step workflows across systems, useful when reporting is one step in a larger automated process.
Notification and delivery services handle the last mile: email servers, Slack integrations, webhook endpoints, and cloud storage destinations. Platforms that include built-in retries, delivery receipts, and run logs reduce the operational burden of keeping scheduled reports reliable.
When evaluating any tool, check for these integrations: your primary database or data warehouse, your ERP and CRM, cloud storage (S3, SharePoint, Google Drive), email delivery, and Slack or webhook support. Authentication and permissions matter too — the tool needs to connect securely without storing credentials in plain text, and access controls should map to your existing role structure. For teams managing multiple operational systems, a platform like Firmanager that centralizes business data can simplify the connector layer significantly.
Cloud-hosted tools reduce infrastructure overhead but require careful review of data residency and access policies. On-premises deployments give more control over sensitive data but require internal resources to maintain.
How do you implement automated reporting? A practical checklist
Implementation works best when you start small, prove value, and expand. Here is the sequence that consistently works.
- Define your KPIs and report requirements. Know exactly what each report needs to show, who the audience is, and how often they need it before touching any tool.
- Map your data sources. Document where each metric comes from, who owns that source, and what the refresh cadence is. Gaps here cause failures later.
- Choose your tool stack. Match tool categories to your BI platform (Power BI, Tableau, Crystal Reports, SSRS) and your delivery requirements.
- Build and test templates. Create report templates with real data, validate outputs against known-good manual reports, and document the expected values for each key metric.
- Pilot with one report. Pick a high-frequency, low-complexity report — a weekly sales summary, a daily ops dashboard — and run it in parallel with the manual version for two to four weeks.
- Iterate, then scale. Fix what the pilot surfaces, then expand to additional reports and recipients.
- Set up monitoring and alerting. Configure run logs, failure alerts, and automatic retries before you decommission the manual process.
Testing is not optional. Validate that the automated output matches the manual baseline before going live. Version-control your templates so changes are tracked and reversible.
Roles and responsibilities matrix:
| Role | Responsibility | Handles exceptions? |
|---|---|---|
| Data owner | Maintains source system accuracy and refresh schedules | Yes — source-level issues |
| Report owner | Defines template logic, KPIs, and distribution list | Yes — output discrepancies |
| Platform admin | Manages tool configuration, credentials, and scheduling | Yes — system failures |
| Recipients | Consume reports, flag anomalies to report owner | No — escalate to report owner |
Real-world automated reporting examples by function
Automated reporting looks different depending on where in the business it runs. Here are four concrete examples, each with the KPIs that matter most.

Finance: A controller automates the weekly P&L summary, pulling from the ERP and consolidating across entities. The report generates every Friday at 5:00 PM and goes to the CFO and department heads as a PDF. KPIs tracked: variance to budget, days sales outstanding, cash position. Delivery mode: scheduled email with PDF attachment.
Marketing: A demand-gen team automates a daily performance dashboard covering paid media spend, leads generated, and cost per acquisition. The dashboard refreshes every morning and is embedded in a shared portal. KPIs tracked: CPL, MQL volume, channel mix. Delivery mode: real-time dashboard with a daily email digest. Data-driven sales teams increasingly tie marketing report outputs directly to pipeline forecasting.
Customer success: A CS team automates a weekly health-score report for all accounts, triggered by a data refresh from the CRM. Accounts below a health threshold generate an alert to the assigned CSM. KPIs tracked: health score, product usage, open tickets. Delivery mode: triggered alert plus scheduled weekly summary.
Operations: A logistics team automates daily on-time delivery reporting across carriers, pulling from the TMS. Exceptions (late shipments above a threshold) trigger an immediate Slack notification. KPIs tracked: on-time delivery rate, average delay, carrier performance. Delivery mode: triggered Slack alert plus daily batched report.
Across all these functions, the pattern is the same: identify the high-frequency, high-stakes report, automate the data assembly, and let the team focus on the exceptions.
What does implementation actually cost and when do you see ROI?
Timeline and cost vary by complexity, but the ranges are predictable.
- Pilot phase: Two to six weeks for a single report or report family. This covers tool setup, connector configuration, template build, and parallel testing.
- Departmental rollout: One to three months to automate a full function's reporting suite, including stakeholder training and governance setup.
- Enterprise rollout: Three to nine months for cross-functional automation covering multiple BI platforms, dozens of report templates, and complex distribution rules.
Cost drivers to budget for:
- Connector complexity — custom API integrations cost more than standard database connectors.
- Number of report templates — each template requires design, testing, and validation time.
- Delivery frequency and channel count — high-frequency reports and multi-channel delivery add infrastructure cost.
- Licensing and hosting — SaaS tools carry subscription fees; on-premises tools carry infrastructure and maintenance costs.
- Integration and consulting time — internal IT hours or external consulting for complex source systems.
ROI benchmark: Automating most manual report production work can recover substantial analyst hours annually and deliver significant cost savings. The value increases further with higher report volumes and more recipients.
The business case for automation is strongest when you can point to a specific report, a specific time cost, and a specific error rate. Vague "efficiency gains" do not survive budget review; concrete hours and error counts do.
What pitfalls and governance gaps kill automated reporting programs?
Automation fails in predictable ways. Most failures are not technical — they are governance failures.
Common pitfalls:
- Broken connectors after a source system upgrade, with no monitoring to catch the failure.
- Stale templates that still reference deprecated fields or old KPI definitions.
- Poor data validation that lets bad data flow through to reports stakeholders trust.
- No data ownership — when the source breaks, no one knows whose job it is to fix it.
- Governance gaps where reports are distributed without access controls, exposing sensitive data to the wrong audience.
Successful automation requires ongoing maintenance: pipeline upkeep, periodic template reviews, and validation testing to keep reports aligned with evolving business definitions.
Governance checklist:
- Assign a named data owner and report owner for every automated report.
- Define SLAs for failure response (e.g., critical reports fixed within four hours).
- Schedule quarterly template reviews to catch stale KPI definitions.
- Implement role-based access controls on all report distribution lists.
- Enable audit logging for every report run, delivery, and access event.
- Document the validation test suite and run it after every source system change.
Monitoring playbook:
- Configure health checks that run before each scheduled report.
- Set alerting thresholds for late runs, failed deliveries, and data validation failures.
- Review run logs weekly during the first 90 days; monthly after stabilization.
- Enable automatic retries with exponential backoff for transient delivery failures.
How ChristianSteven Software maps to your automated reporting workflow
ChristianSteven Software has spent more than two decades building tools that handle the scheduling, generation, and distribution layers of the automated reporting workflow — the parts most BI platforms handle poorly or not at all.
PBRS (Power BI Reports Scheduler) automates Power BI report exports and distribution. It handles scheduled delivery, burst reporting to large recipient lists, and conditional distribution rules that the native Power BI service cannot replicate. Teams that need Power BI automated exports without building Power Automate flows use PBRS to get there faster and with more control.
ATRS (Automated Tableau Report Scheduler) does the same for Tableau environments. It schedules Tableau report generation, applies filters per recipient, and distributes via email, file share, or other channels. For teams that need to automate Tableau report delivery at scale, ATRS removes the manual steps entirely.
CRD (Crystal Reports Distributor) handles Crystal Reports scheduling and distribution, including burst reporting, dynamic recipient lists, and multi-format output. It is the tool of choice for organizations that have invested heavily in Crystal Reports and need reliable, hands-free delivery.
IntelliFront BI provides real-time dashboard and KPI monitoring, giving stakeholders a live view of operational metrics without waiting for a scheduled report run.
The SOC 2 Type II certification and 20-plus years of focused experience in BI automation are the credibility signals that matter most in enterprise procurement. These are not marketing claims — they are audited and verifiable.
A typical implementation scenario: a finance team running weekly P&L reports in Crystal Reports manually exports and emails them every Friday. With CRD, the same reports generate automatically at a scheduled time, apply recipient-specific filters, and deliver as PDFs to a distribution list. The analyst who previously spent significant time on Friday afternoon now reviews the output for exceptions instead.
Key Takeaways
Automated reporting replaces manual data assembly with a scheduled, validated, and governed workflow that delivers consistent reports to the right people without human intervention every cycle.
| Point | Details |
|---|---|
| Core workflow | Automation covers extraction, transformation, generation, and distribution — interpretation stays with analysts. |
| Time and accuracy gains | Automating high-frequency reports can recover hundreds of analyst hours per year while eliminating manual entry errors. |
| Governance is non-negotiable | Every automated report needs a named owner, SLA, access controls, and a quarterly review cycle to stay reliable. |
| Start with a pilot | Pick one high-frequency, low-complexity report, run it in parallel for two to four weeks, then scale. |
| ChristianSteven Software fit | PBRS, ATRS, CRD, and IntelliFront BI cover Power BI, Tableau, Crystal Reports, and real-time dashboards with SOC 2 Type II security. |
The case for starting smaller than you think
Most teams that struggle with report automation do not fail because the technology is hard. They fail because they try to automate everything at once and end up with a fragile system no one trusts.
The smarter path is to pick one report that runs at least weekly, costs someone real time to produce, and has a clear definition of "correct." Automate that one. Measure the time saved. Show stakeholders the output is reliable. Then expand.
The governance piece gets underestimated every time. Automation without ownership is just a scheduled failure waiting to happen. Assign a data owner and a report owner before you go live, not after something breaks.
The analyst role shift is worth addressing directly with your team. The transition from "I build the report" to "I review the output and handle exceptions" feels like a demotion to some people. It is not. Exception handling requires more judgment, not less. The teams that communicate this clearly during implementation have far fewer adoption problems than the ones that treat it as a purely technical project.
Ready to cut manual reporting time with ChristianSteven Software?
If your team is still spending hours each week assembling reports that could run automatically, the gap between where you are and where you could be is mostly a configuration problem, not a technology problem. ChristianSteven Software's schedulers — PBRS for Power BI, ATRS for Tableau, and CRD for Crystal Reports — handle the generation and distribution layers your BI platform leaves incomplete. IntelliFront BI adds real-time dashboard visibility for teams that need live KPI monitoring between scheduled runs.
With SOC 2 Type II certification and more than two decades of focused BI automation experience, ChristianSteven Software is built for enterprise environments where security and reliability are requirements, not preferences. Request a demo or start your PBRS pilot to see how quickly a high-frequency report can move from manual to automatic.
FAQ
What is automated reporting in simple terms?
Automated reporting is software that collects data from your business systems, formats it into a report, and delivers it to the right people on a schedule or trigger — without anyone doing it manually each time.
How long does it take to implement automated reporting?
A pilot covering one report typically takes two to six weeks. A full departmental rollout runs one to three months, and enterprise-wide automation across multiple BI platforms can take three to nine months depending on complexity.
What is the difference between a scheduled report and a triggered report?
A scheduled report runs on a fixed cadence (daily, weekly, monthly). A triggered report fires when a specific condition is met, such as a KPI crossing a threshold or a data anomaly being detected.
Which ChristianSteven Software products support automated reporting?
ChristianSteven Software offers PBRS for Power BI scheduling and export, ATRS for Tableau report automation, CRD for Crystal Reports distribution, and IntelliFront BI for real-time dashboards and KPI monitoring.
Does automated reporting replace business analysts?
No. Automated reporting removes the manual data assembly work, shifting analysts from report builders to exception handlers. Strategic interpretation, anomaly investigation, and ad-hoc analysis remain human responsibilities.